

Question: 5 portfolio. Stocks' monthly returns.) e. The table in the popup window, shows the returns on an annualized basis that were realized from holding long-term
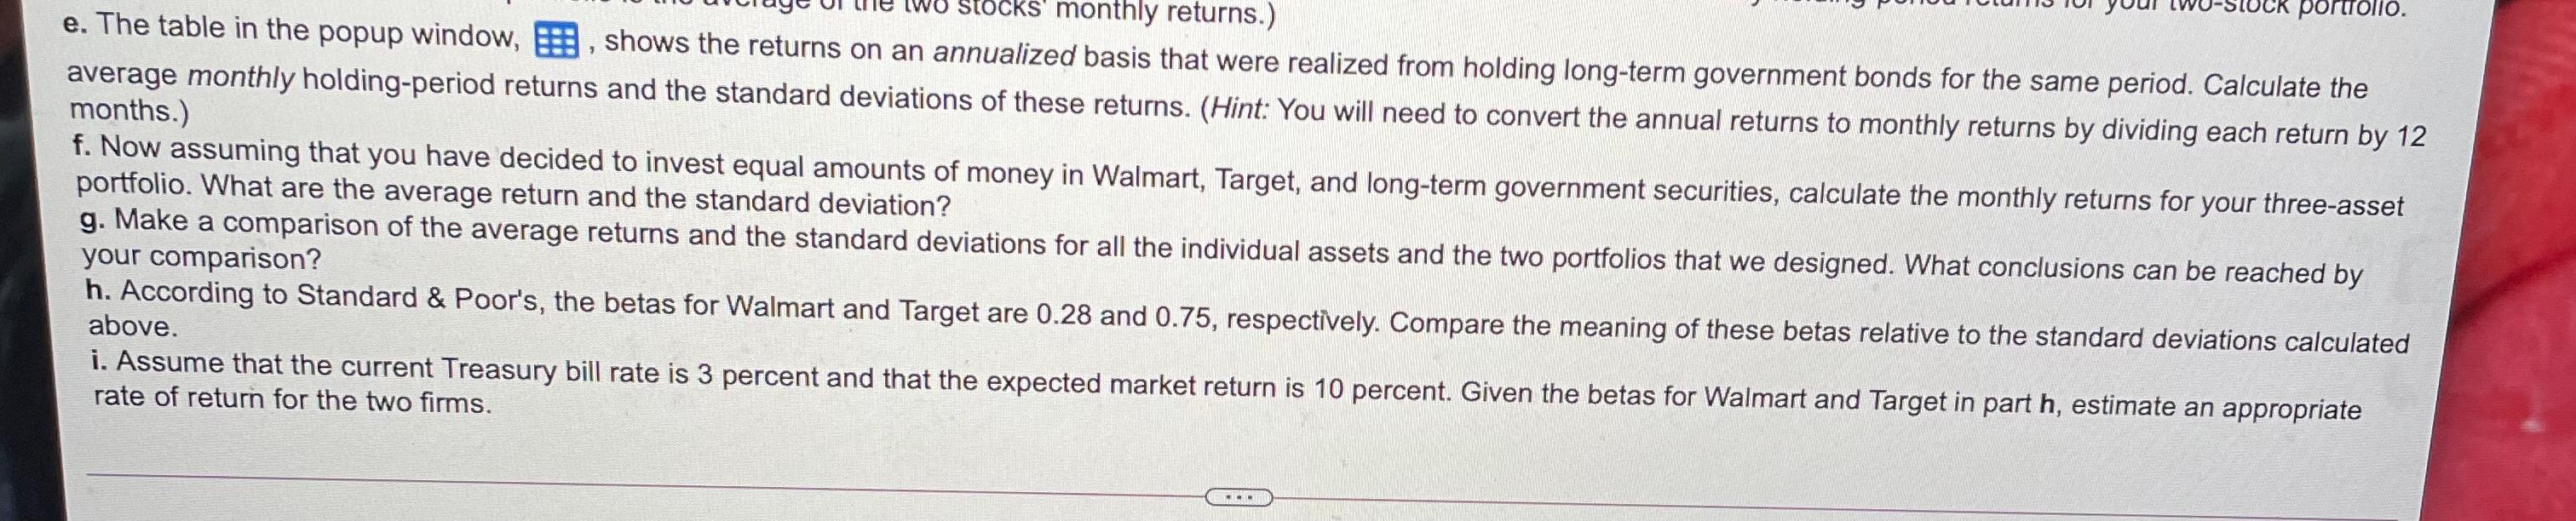
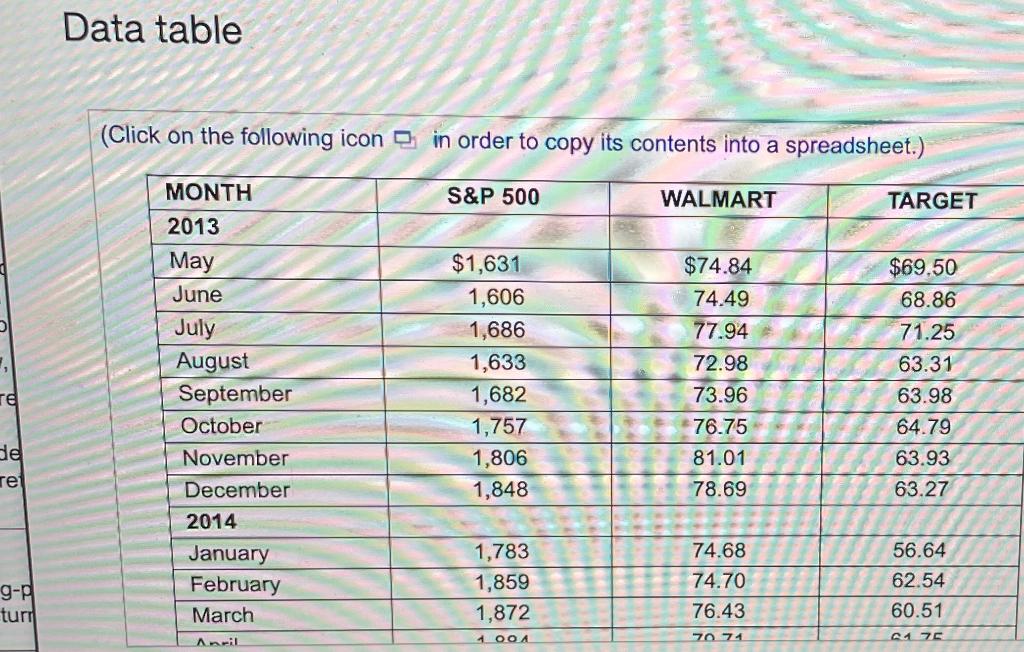
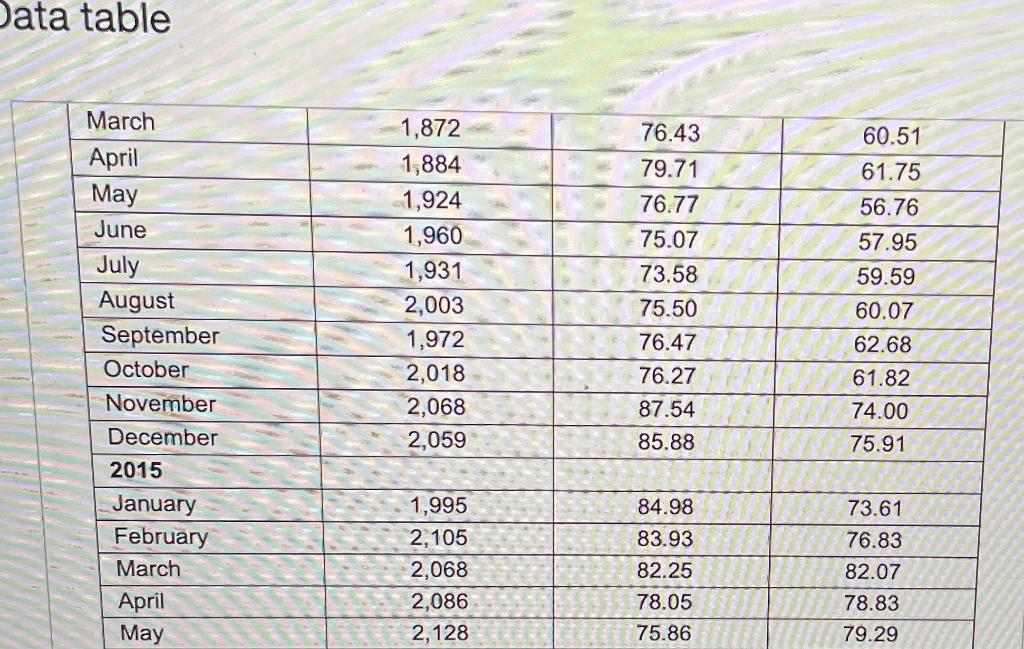
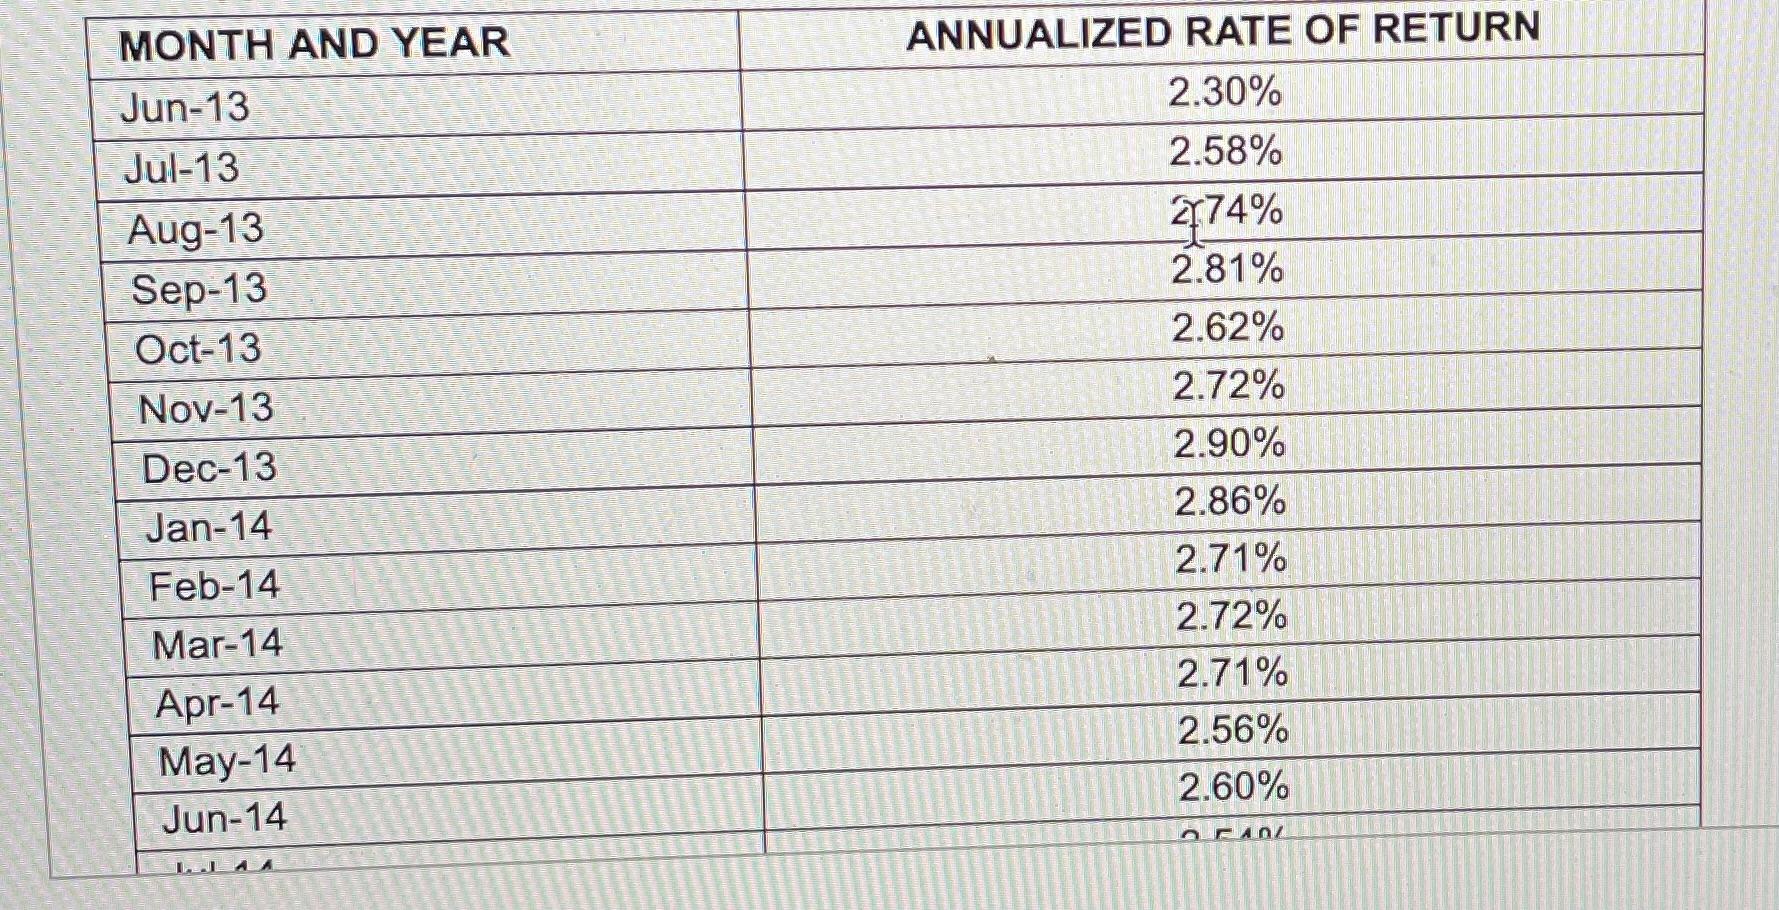
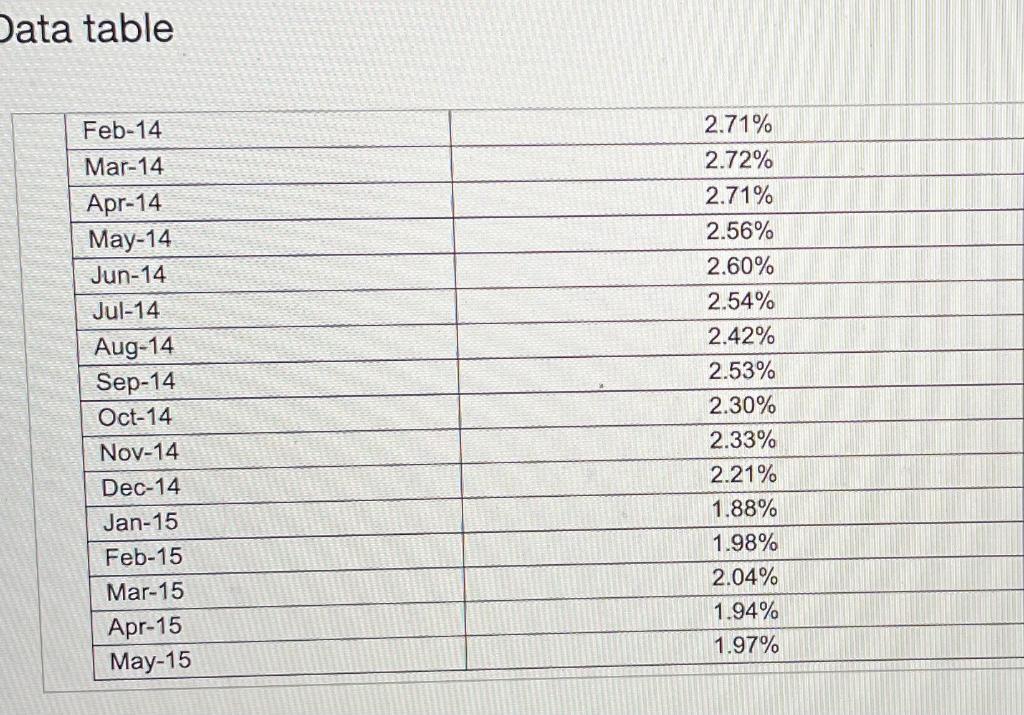
5 portfolio. Stocks' monthly returns.) e. The table in the popup window, shows the returns on an annualized basis that were realized from holding long-term government bonds for the same period. Calculate the average monthly holding-period returns and the standard deviations of these returns. (Hint: You will need to convert the annual returns to monthly returns by dividing each return by 12 months.) f. Now assuming that you have decided to invest equal amounts of money in Walmart, Target, and long-term government securities, calculate the monthly returns for your three-asset portfolio. What are the average return and the standard deviation? g. Make a comparison of the average returns and the standard deviations for all the individual assets and the two portfolios that we designed. What conclusions can be reached by your comparison? h. According to Standard & Poor's, the betas for Walmart and Target are 0.28 and 0.75, respectively. Compare the meaning of these betas relative to the standard deviations calculated above. i. Assume that the current Treasury bill rate is 3 percent and that the expected market return is 10 percent. Given the betas for Walmart and Target in part h, estimate an appropriate rate of return for the two firms. Data table (Click on the following icon in order to copy its contents into a spreadsheet.) S&P 500 WALMART TARGET MONTH 2013 May June July August September October November December 2014 January February March $1,631 1,606 1,686 1,633 1,682 1,757 1,806 1,848 $74.84 74.49 77.94 72.98 73.96 76.75 81.01 78.69 $69.50 68.86 71.25 63.31 63.98 64.79 63.93 63.27 re de re 1,783 1,859 1,872 74.68 74.70 76.43 56.64 62.54 60.51 g-pl turi Abril 1004 70 71 0176 Data table March April May June July August September October November December 2015 January February March April May 1,872 1,884 1,924 1,960 1,931 2,003 1,972 2,018 2,068 2,059 76.43 79.71 76.77 75.07 73.58 75.50 76.47 76.27 87.54 85.88 60.51 61.75 56.76 57.95 59.59 60.07 62.68 61.82 74.00 75.91 1,995 2,105 2,068 2,086 2,128 84.98 83.93 82.25 78.05 75.86 73.61 76.83 82.07 78.83 79.29 MONTH AND YEAR Jun-13 Jul-13 Aug-13 Sep-13 Oct-13 Nov-13 ANNUALIZED RATE OF RETURN 2.30% 2.58% 474% 2.81% 2.62% 2.72% 2.90% 2.86% 2.71% 2.72% 2.71% 2.56% 2.60% Dec-13 Jan-14 Feb-14 Mar-14 Apr-14 May-14 Jun-14 AZ LLA Data table Feb-14 Mar-14 Apr-14 May-14 Jun-14 Jul-14 Aug-14 Sep-14 Oct-14 Nov-14 Dec-14 Jan-15 Feb-15 Mar-15 Apr-15 May-15 2.71% 2.72% 2.71% 2.56% 2.60% 2.54% 2.42% 2.53% 2.30% 2.33% 2.21% 1.88% 1.98% 2.04% 1.94% 1.97% 5 portfolio. Stocks' monthly returns.) e. The table in the popup window, shows the returns on an annualized basis that were realized from holding long-term government bonds for the same period. Calculate the average monthly holding-period returns and the standard deviations of these returns. (Hint: You will need to convert the annual returns to monthly returns by dividing each return by 12 months.) f. Now assuming that you have decided to invest equal amounts of money in Walmart, Target, and long-term government securities, calculate the monthly returns for your three-asset portfolio. What are the average return and the standard deviation? g. Make a comparison of the average returns and the standard deviations for all the individual assets and the two portfolios that we designed. What conclusions can be reached by your comparison? h. According to Standard & Poor's, the betas for Walmart and Target are 0.28 and 0.75, respectively. Compare the meaning of these betas relative to the standard deviations calculated above. i. Assume that the current Treasury bill rate is 3 percent and that the expected market return is 10 percent. Given the betas for Walmart and Target in part h, estimate an appropriate rate of return for the two firms. Data table (Click on the following icon in order to copy its contents into a spreadsheet.) S&P 500 WALMART TARGET MONTH 2013 May June July August September October November December 2014 January February March $1,631 1,606 1,686 1,633 1,682 1,757 1,806 1,848 $74.84 74.49 77.94 72.98 73.96 76.75 81.01 78.69 $69.50 68.86 71.25 63.31 63.98 64.79 63.93 63.27 re de re 1,783 1,859 1,872 74.68 74.70 76.43 56.64 62.54 60.51 g-pl turi Abril 1004 70 71 0176 Data table March April May June July August September October November December 2015 January February March April May 1,872 1,884 1,924 1,960 1,931 2,003 1,972 2,018 2,068 2,059 76.43 79.71 76.77 75.07 73.58 75.50 76.47 76.27 87.54 85.88 60.51 61.75 56.76 57.95 59.59 60.07 62.68 61.82 74.00 75.91 1,995 2,105 2,068 2,086 2,128 84.98 83.93 82.25 78.05 75.86 73.61 76.83 82.07 78.83 79.29 MONTH AND YEAR Jun-13 Jul-13 Aug-13 Sep-13 Oct-13 Nov-13 ANNUALIZED RATE OF RETURN 2.30% 2.58% 474% 2.81% 2.62% 2.72% 2.90% 2.86% 2.71% 2.72% 2.71% 2.56% 2.60% Dec-13 Jan-14 Feb-14 Mar-14 Apr-14 May-14 Jun-14 AZ LLA Data table Feb-14 Mar-14 Apr-14 May-14 Jun-14 Jul-14 Aug-14 Sep-14 Oct-14 Nov-14 Dec-14 Jan-15 Feb-15 Mar-15 Apr-15 May-15 2.71% 2.72% 2.71% 2.56% 2.60% 2.54% 2.42% 2.53% 2.30% 2.33% 2.21% 1.88% 1.98% 2.04% 1.94% 1.97%
Step by Step Solution
There are 3 Steps involved in it

Get step-by-step solutions from verified subject matter experts