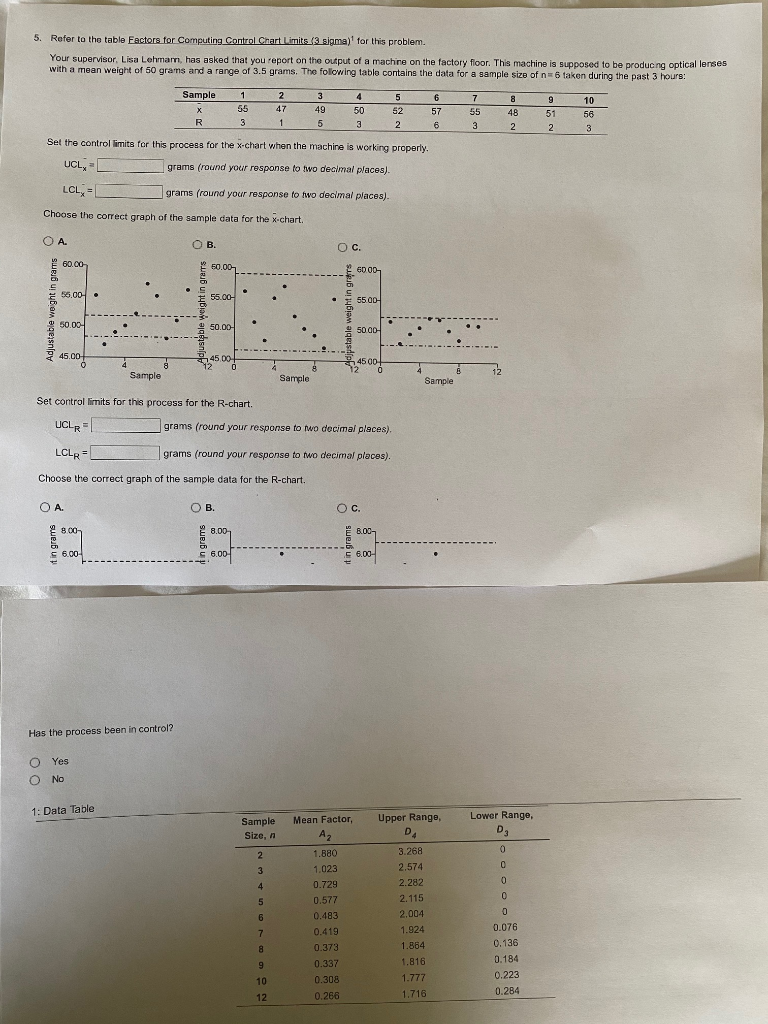
Question: 5. Refer to the table Factors for Computing Control Chart Limits (3 sigma) for this problem. Your supervisor. Lisa Lehmam, has asked that you report

5. Refer to the table Factors for Computing

5. Refer to the table Factors for Computing Control Chart Limits (3 sigma) for this problem. Your supervisor. Lisa Lehmam, has asked that you report on the output of a machine on the factory floor. This machine is supposed to be producng optical lenses with a mean weight of 50 grams and a range of 3.5 grams. The following table contains the data for a sample size of ne taken during the past 3 hours! Sample X R 3 1 55 2 47 1 3 49 4 50 3 5 52 2 6 57 6 7 55 3 8 48 2 9 51 2 10 56 3 5 Set the control limits for this process for the x-chart when the machine is working properly. UCL, grams (round your response to two decimal places). LCL, grams (round your response to two decimal places). Choose the correct graph of the sample data for the x-chart. . OB. 60.00 Oc. 60.00 8 56.00c 8 Adjustable weight in grams Adjustable weight in graris Adjustable weight in gars 50.00 . 50.00 45.00 4500 Sample Sample Sample Set control limits for this process for the R-chart. UCL grams (round your response to two decimal places). LCL grams (round your response to two decimal places). Choose the correct graph of the sample data for the R-chart. O A. OB. Oc. swesBuy co in grams it in grams Has the process been in control? O O Yes No 1: Data Table Upper Range, Lower Range, Sample Size, Mean Factor, AZ 1.880 1.023 0.729 0.577 0.483 0.419 0.373 0.337 0.308 0.266 3.268 2.574 2.282 2.115 2.004 1.924 1.864 1.816 1.777 1.716 0.076 0.136 0.184 0.223 0.284

Step by Step Solution

There are 3 Steps involved in it

1 Expert Approved Answer
Step: 1 Unlock blur-text-image
Question Has Been Solved by an Expert!

Get step-by-step solutions from verified subject matter experts

Step: 2 Unlock
Step: 3 Unlock

Students Have Also Explored These Related General Management Questions!