

Question: 5) You apply CCA on x and y 2-D data plotted separately in the figure below (in x-space and y-space) where the colorbar shows the
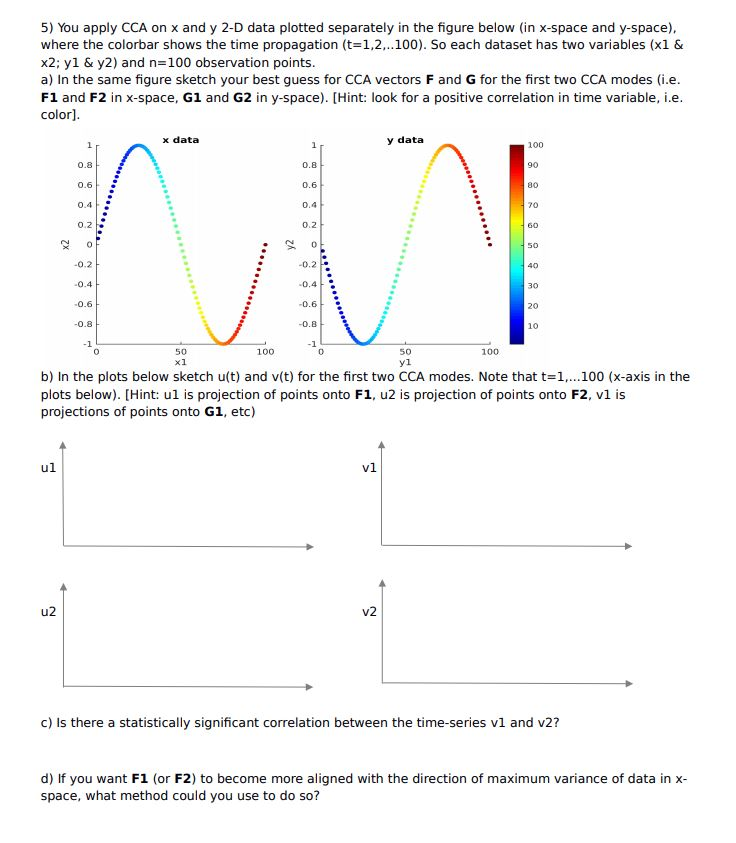
5) You apply CCA on x and y 2-D data plotted separately in the figure below (in x-space and y-space) where the colorbar shows the time propagation (t 1,2,..100). So each dataset has two variables (xl & x2; yl & y2) and n-100 observation points. a) In the same figure sketch your best guess for CCA vectors F and G for the first two CCA modes (i.e color] Fl and F2 in x-space, Gl and G2 in y-space). [Hint: look for a positive correlation in time variable, i.e x data y data 0.8 0.6 0.4 0.2 0.8 0.6 0.4 0.2 100 90 80 70 50 -0.2 0.4 0.6 0.8 0.2 0.4 0.6 0.8 30 10 100 50 x1 100 yl b) In the plots below sketch u(t) and v(t) for the first two CCA modes. Note that t-1.100 (x-axis in the plots below). [Hint: ul is projection of points onto F1, u2 is projection of points onto F2, vl is projections of points onto G1, etc) c) Is there a statistically significant correlation between the time-series vl and v2? d) If you want F1 (or F2) to become more aligned with the direction of maximum variance of data in x space, what method could you use to do so? 5) You apply CCA on x and y 2-D data plotted separately in the figure below (in x-space and y-space) where the colorbar shows the time propagation (t 1,2,..100). So each dataset has two variables (xl & x2; yl & y2) and n-100 observation points. a) In the same figure sketch your best guess for CCA vectors F and G for the first two CCA modes (i.e color] Fl and F2 in x-space, Gl and G2 in y-space). [Hint: look for a positive correlation in time variable, i.e x data y data 0.8 0.6 0.4 0.2 0.8 0.6 0.4 0.2 100 90 80 70 50 -0.2 0.4 0.6 0.8 0.2 0.4 0.6 0.8 30 10 100 50 x1 100 yl b) In the plots below sketch u(t) and v(t) for the first two CCA modes. Note that t-1.100 (x-axis in the plots below). [Hint: ul is projection of points onto F1, u2 is projection of points onto F2, vl is projections of points onto G1, etc) c) Is there a statistically significant correlation between the time-series vl and v2? d) If you want F1 (or F2) to become more aligned with the direction of maximum variance of data in x space, what method could you use to do so
Step by Step Solution
There are 3 Steps involved in it

Get step-by-step solutions from verified subject matter experts