

Question: ? 5.3. HOME 2- Calculating Returns and Standard Deviations - Excel INSERTPAGE LAYOUT FORMULAS DATA REVIEW VIEW - 6x| Sign In FILE -12 Arial B
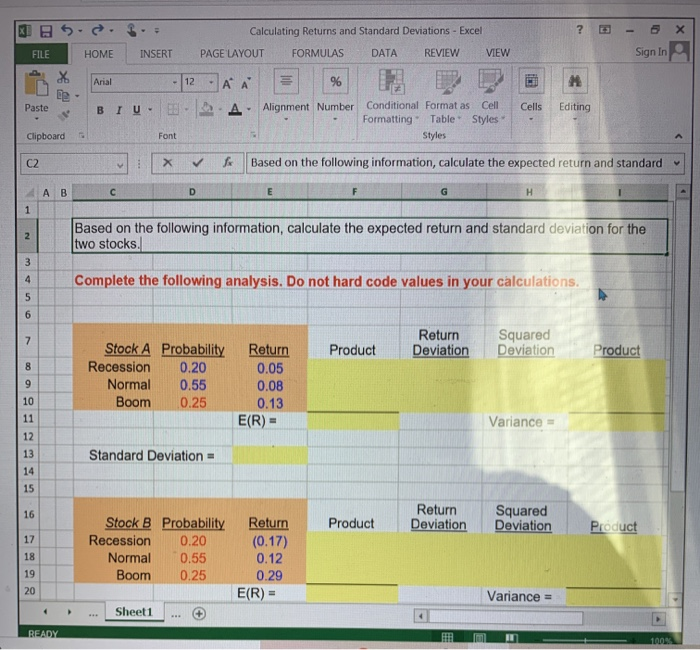
? 5.3. HOME 2- Calculating Returns and Standard Deviations - Excel INSERTPAGE LAYOUT FORMULAS DATA REVIEW VIEW - 6x| Sign In FILE -12 Arial B T A A A Paste U - Alignment Number Cells Editing Conditional Format as Cell Formatting Table Styles Styles Clipboard Font X f Based on the following information, calculate the expected return and standard AB Based on the following information, calculate the expected return and standard deviation for the two stocks. Complete the following analysis. Do not hard code values in your calculations. Product Return Deviation Squared Deviation Product Stock A Probability Recession 0.20 Normal 0.55 Boom 0.25 Return 0.05 0.08 0.13 E(R) = Variance = Standard Deviation = Product Return Deviation Squared Deviation Product Stock B Recession Normal Boom Probability 0.20 0.55 0.25 Return (0.17) 0.12 0.29 E(R) = Variance = Sheet1 READY
Step by Step Solution
There are 3 Steps involved in it

Get step-by-step solutions from verified subject matter experts