

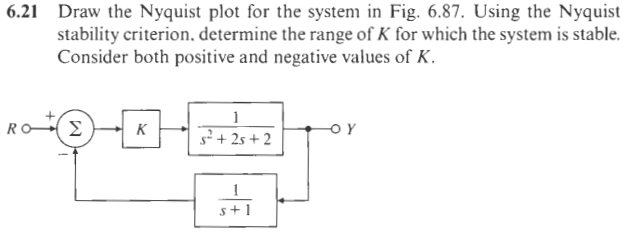
Question: 6 . 2 1 Draw the Nyquist plot for the system in Fig. 6 . 8 7 . Using the Nyquist stability criterion. determine the
Draw the Nyquist plot for the system in Fig. Using the Nyquist stability criterion. determine the range of K for which the system is stable. Consider both positive and negative values of K
Step by Step Solution
There are 3 Steps involved in it
1 Expert Approved Answer
Step: 1 Unlock

Question Has Been Solved by an Expert!
Get step-by-step solutions from verified subject matter experts
Step: 2 Unlock
Step: 3 Unlock