

Question: Method 2 is non-Bode method of Frequency Response. Problem 3 Consider a unity feedback control structure with plant and controller: k P(S) Y(s) U(s) (s
Method 2 is non-Bode method of Frequency Response.
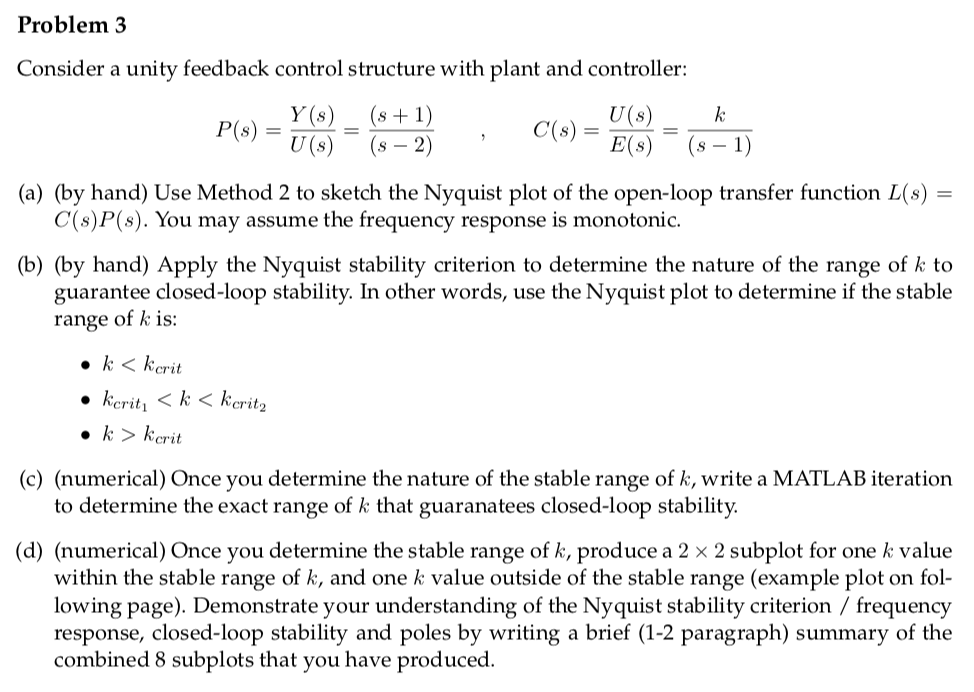
Problem 3 Consider a unity feedback control structure with plant and controller: k P(S) Y(s) U(s) (s + 1) (s 2) C(s) U(S) E(S) 1) = (a) (by hand) Use Method 2 to sketch the Nyquist plot of the open-loop transfer function L(s) C($)P(s). You may assume the frequency response is monotonic. (b) (by hand) Apply the Nyquist stability criterion to determine the nature of the range of k to guarantee closed-loop stability. In other words, use the Nyquist plot to determine if the stable range of k is: k kerit (c) (numerical) Once you determine the nature of the stable range of k, write a MATLAB iteration to determine the exact range of k that guaranatees closed-loop stability. (d) (numerical) Once you determine the stable range of k, produce a 2 x 2 subplot for one k value within the stable range of k, and one k value outside of the stable range (example plot on fol- lowing page). Demonstrate your understanding of the Nyquist stability criterion / frequency response, closed-loop stability and poles by writing a brief (1-2 paragraph) summary of the combined 8 subplots that you have produced. Problem 3 Consider a unity feedback control structure with plant and controller: k P(S) Y(s) U(s) (s + 1) (s 2) C(s) U(S) E(S) 1) = (a) (by hand) Use Method 2 to sketch the Nyquist plot of the open-loop transfer function L(s) C($)P(s). You may assume the frequency response is monotonic. (b) (by hand) Apply the Nyquist stability criterion to determine the nature of the range of k to guarantee closed-loop stability. In other words, use the Nyquist plot to determine if the stable range of k is: k kerit (c) (numerical) Once you determine the nature of the stable range of k, write a MATLAB iteration to determine the exact range of k that guaranatees closed-loop stability. (d) (numerical) Once you determine the stable range of k, produce a 2 x 2 subplot for one k value within the stable range of k, and one k value outside of the stable range (example plot on fol- lowing page). Demonstrate your understanding of the Nyquist stability criterion / frequency response, closed-loop stability and poles by writing a brief (1-2 paragraph) summary of the combined 8 subplots that you have produced
Step by Step Solution
There are 3 Steps involved in it

Get step-by-step solutions from verified subject matter experts