

Question: 6- Calculate control limits (UCL, CL and LCL) for 1 bar chart and R-chart data represented next page (Plotting is not required. Make sure you
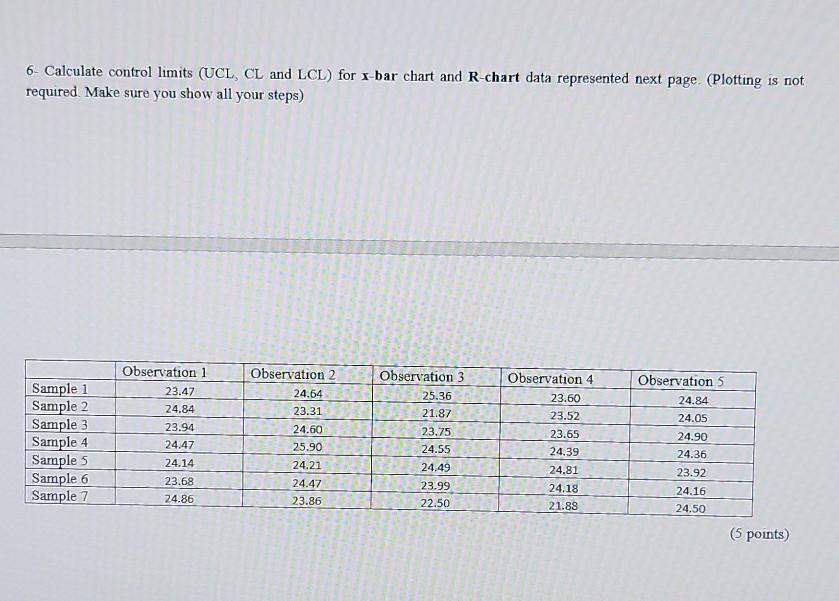
6- Calculate control limits (UCL, CL and LCL) for 1 bar chart and R-chart data represented next page (Plotting is not required. Make sure you show all your steps) Sample 1 Sample 2 Sample 3 Sample 4 Sample 5 Sample 6 Sample 7 Observation 1 23.47 24.84 23.94 24.47 24.14 Observation 2 24.64 23.31 24.60 25.90 Observation 3 25.36 21.87 23.75 24.55 24.49 23.99 22.50 Observation 4 23.60 23.52 23.65 24.39 24.81 24.18 21.88 Observation 5 24.84 24.05 24.90 24.36 23.92 24.16 24.50 23.68 24.86 24.21 24.47 23.86 (5 points)
Step by Step Solution
There are 3 Steps involved in it
1 Expert Approved Answer
Step: 1 Unlock

Question Has Been Solved by an Expert!
Get step-by-step solutions from verified subject matter experts
Step: 2 Unlock
Step: 3 Unlock