

Question: 6. I want you to use the boxplot method to identify outliers in your data set for the mileage/size variable. I want you to consider
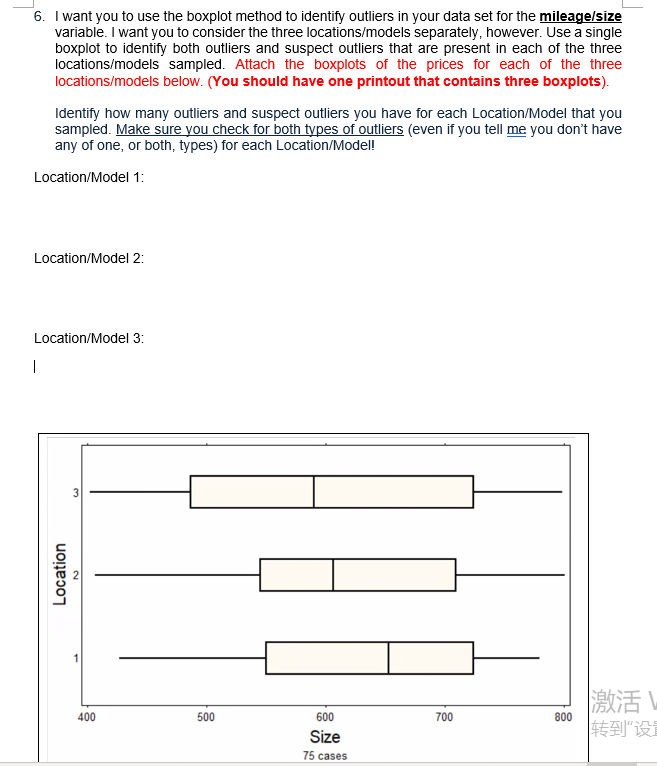
6. I want you to use the boxplot method to identify outliers in your data set for the mileage/size variable. I want you to consider the three locations/models separately, however. Use a single boxplot to identify both outliers and suspect outliers that are present in each of the three locations/models sampled. Attach the boxplots of the prices for each of the three locations/models below. (You should have one printout that contains three boxplots). Identify how many outliers and suspect outliers you have for each Location/Model that you sampled. Make sure you check for both types of outliers (even if you tell me you don't have any of one, or both, types) for each Location/Model! Location/Model 1: Location/Model 2: Location/Model 3: 3 Location 2 1 400 500 600 700 800 Size 75 cases
Step by Step Solution
There are 3 Steps involved in it

Get step-by-step solutions from verified subject matter experts