

Question: 6. The figure below shows a randomization distribution based on 1,000 simulated samples for testing Ho:p = 0.3 vs Ha:p

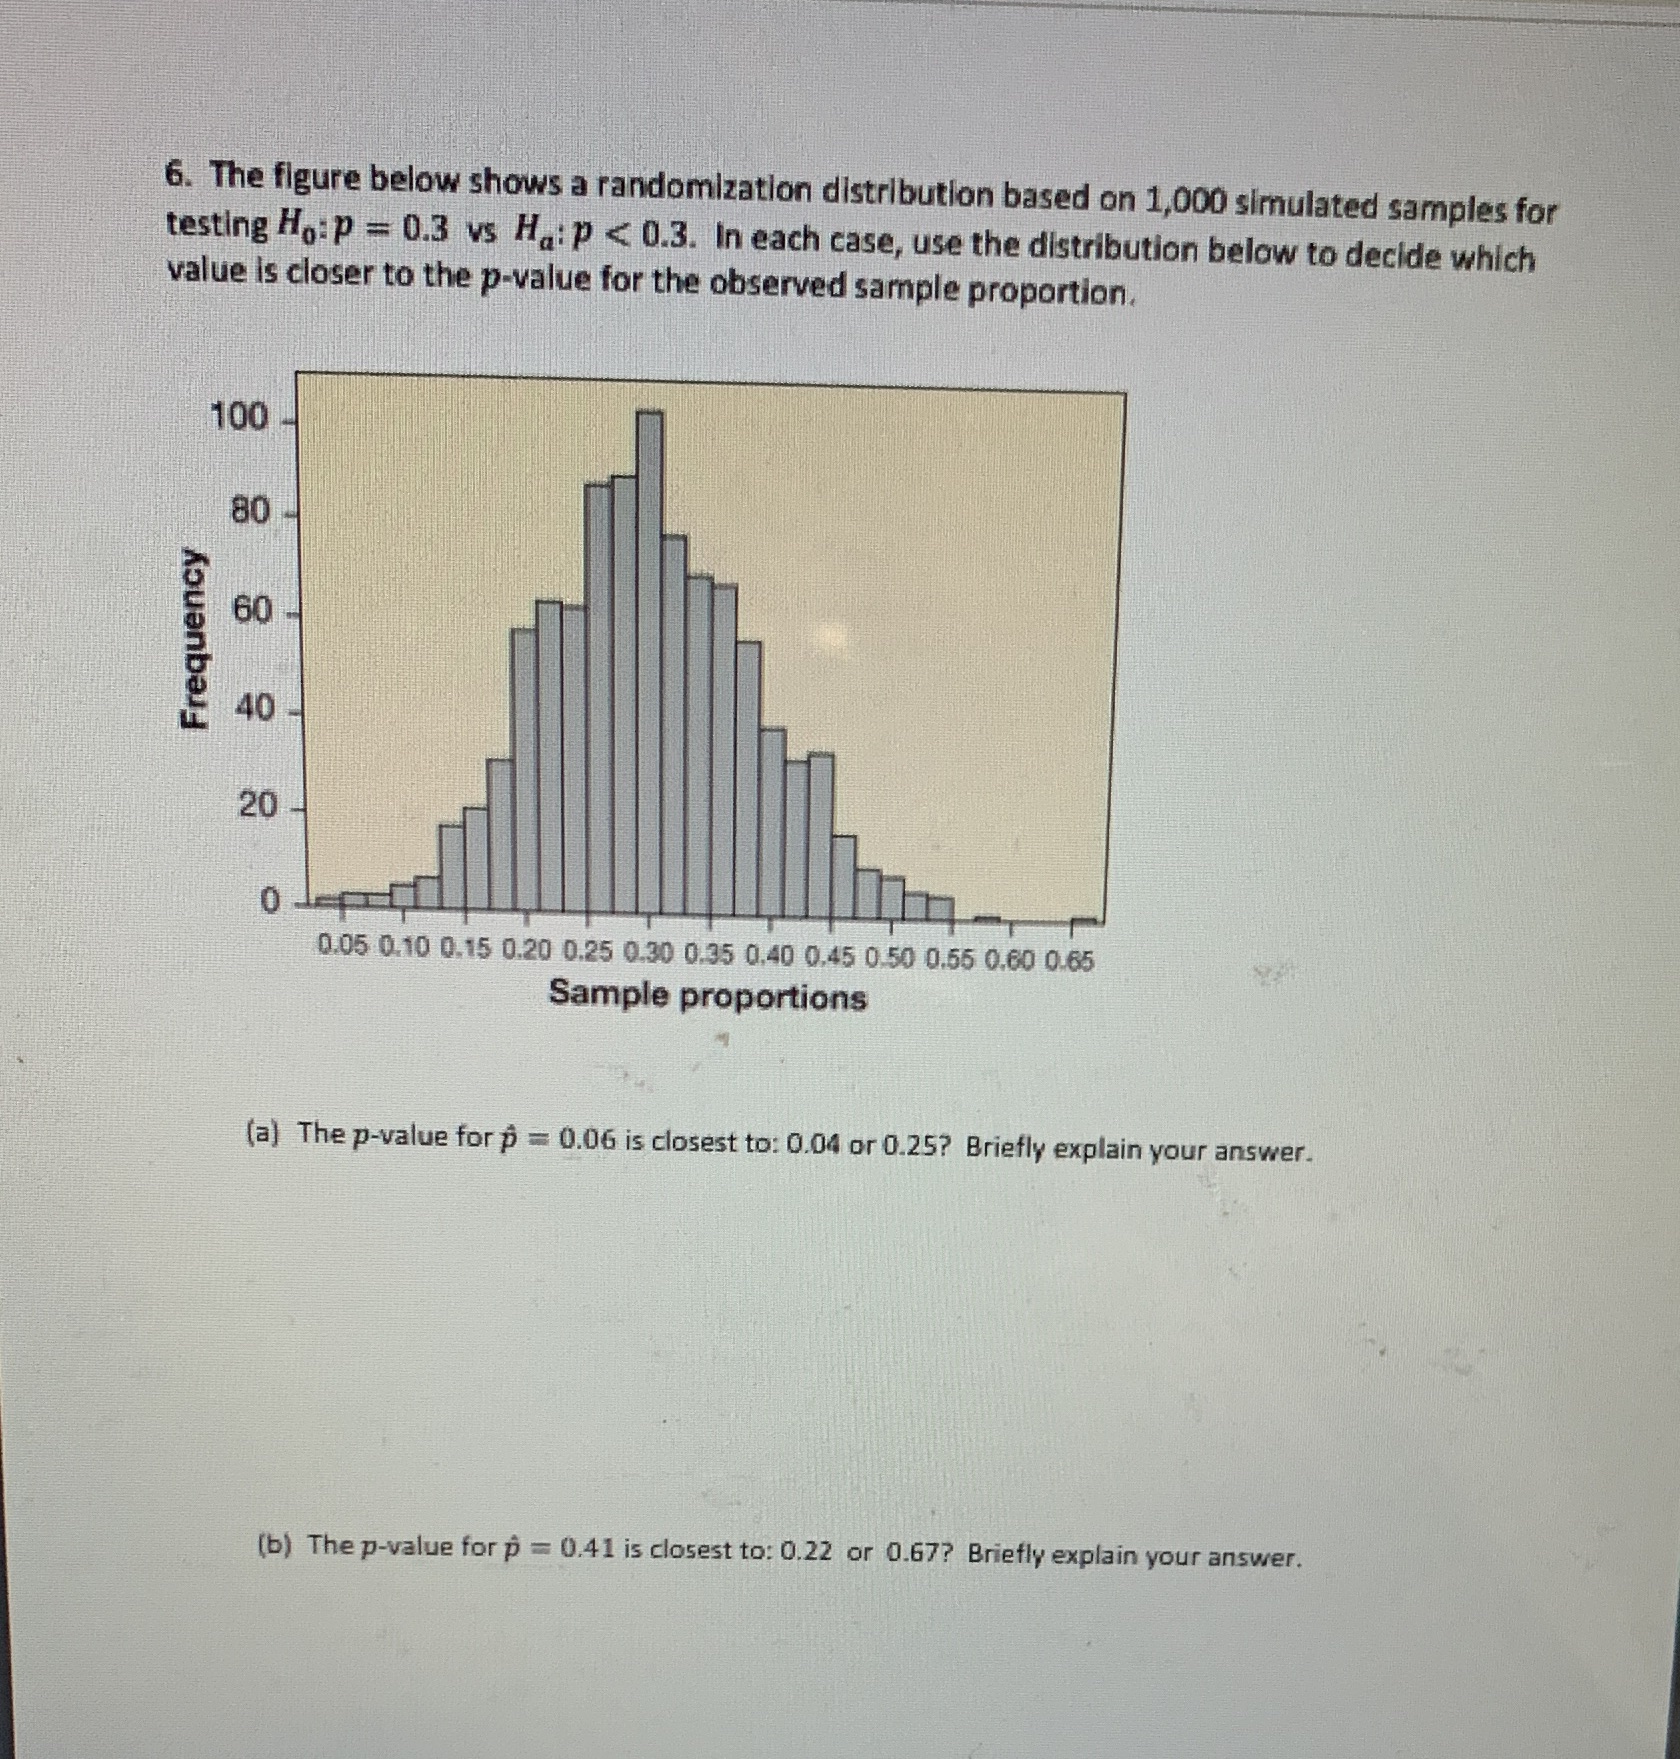
6. The figure below shows a randomization distribution based on 1,000 simulated samples for testing Ho:p = 0.3 vs Ha:p
Step by Step Solution
There are 3 Steps involved in it
1 Expert Approved Answer
Step: 1 Unlock

Question Has Been Solved by an Expert!
Get step-by-step solutions from verified subject matter experts
Step: 2 Unlock
Step: 3 Unlock