

Question: Figure 4.16 shows a randomization distribution for testing H 0 : μ 1 = μ 2 vs H a : μ 1 μ 2 .
Figure 4.16 shows a randomization distribution for testing H0: μ1= μ2vs Ha: μ1‰ μ2. The statistic used for each sample is D = xÌ…1ˆ’ xÌ…2. In each case, use the distribution to decide which value is closer to the p-value for the observed difference in sample means.
Figure 4.16
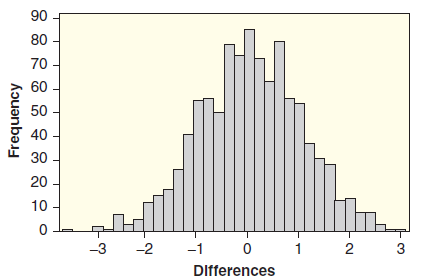 (a) The p-value for D = xÌ…1 ˆ’ xÌ…2 = ˆ’2.9 is closest to: 0.01 or 0.250?
(b) The p-value for D = xÌ…1 ˆ’ xÌ…2 = 1.2 is closest to: 0.30 or 0.60?
A randomization distribution based on 1000 simulated samples is given along with the relevant null and alternative hypotheses. Which p-value most closely matches the observed statistic?
90 80 70 60 50 40 30 20 10 -3 -2 -1 2 3 Differences Frequency
Step by Step Solution
3.40 Rating (169 Votes )
There are 3 Steps involved in it
This is a twotail test so in each case we find the area beyond th... View full answer

Get step-by-step solutions from verified subject matter experts