

Question: Figure 4.15 shows a randomization distribution for testing H 0 : p = 0.3 vs H a : p < 0.3. In each case, use
Figure 4.15
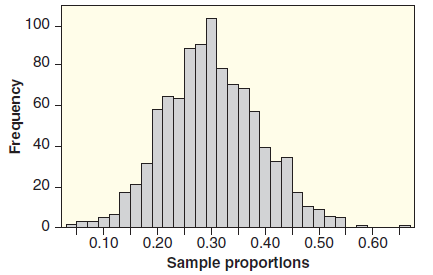 (a) The p-value for p̂ = 0.25 is closest to: 0.001 or 0.30?
(b) The p-value for p̂ = 0.15 is closest to: 0.04 or 0.40?
(c) The p-value for p̂ = 0.35 is closest to: 0.30 or 0.70?
A randomization distribution based on 1000 simulated samples is given along with the relevant null and alternative hypotheses. Which p-value most closely matches the observed statistic?
100 80 60 40 20 0.50 0.40 0.60 0.10 0.20 0.30 Sample proportlons Frequency
Step by Step Solution
3.40 Rating (159 Votes )
There are 3 Steps involved in it
This is a lefttail test so in each case we are estimating ... View full answer

Get step-by-step solutions from verified subject matter experts