

Question: Figure 4.14 shows a randomization distribution for testing H 0 : μ = 50 vs H a : μ > 50. In each case, use
Figure 4.14 shows a randomization distribution for testing H0: μ = 50 vs Ha: μ > 50. In each case, use the distribution to decide which value is closer to the p-value for the observed sample mean.
Figure 4.14
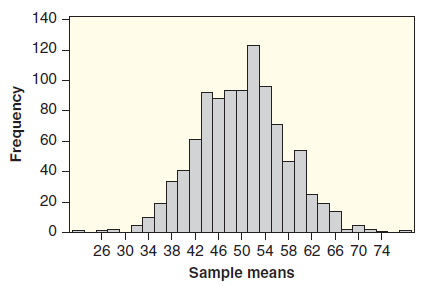 (a) The p-value for x = 68 is closest to: 0.01 or 0.25?
(b) The p-value for x = 54 is closest to: 0.10 or 0.30?
(c) The p-value for x = 63 is closest to: 0.05 or 0.50?
A randomization distribution based on 1000 simulated samples is given along with the relevant null and alternative hypotheses. Which p-value most closely matches the observed statistic?
140 120 100 - 80 60 40- 20 26 30 34 38 42 46 50 54 58 62 66 70 74 Sample means Frequency
Step by Step Solution
3.49 Rating (169 Votes )
There are 3 Steps involved in it
This is a righttail test so in each case we are estimating t... View full answer

Get step-by-step solutions from verified subject matter experts