

Question: 6. The graph shows the average monthly temperature, degrees Celsius, for Thompson, MB. The data can be modeled by an equation of the form
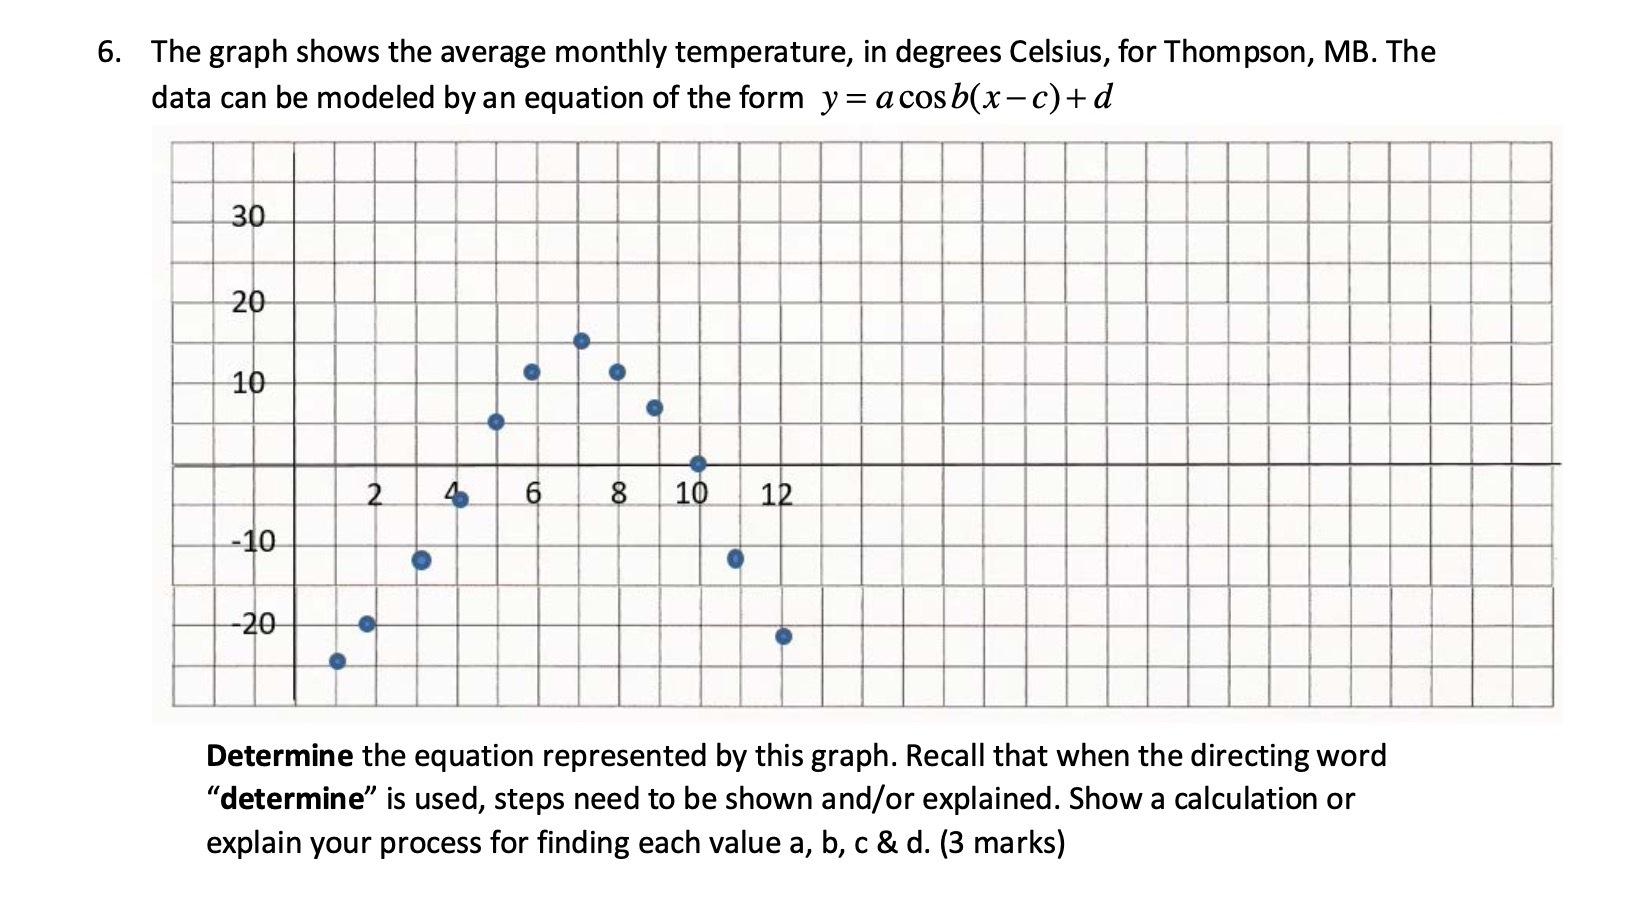
6. The graph shows the average monthly temperature, degrees Celsius, for Thompson, MB. The data can be modeled by an equation of the form y = a cos b(x-c)+ d 30 20 10 -10 -20 2 4 O 6 8 10 12 Determine the equation represented by this graph. Recall that when the directing word "determine" is used, steps need to be shown and/or explained. Show a calculation or explain your process for finding each value a, b, c & d. (3 marks)
Step by Step Solution
There are 3 Steps involved in it
1 Expert Approved Answer
Step: 1 Unlock

Question Has Been Solved by an Expert!
Get step-by-step solutions from verified subject matter experts
Step: 2 Unlock
Step: 3 Unlock