

Question: 9 A design engineer wants to construct a sample mean chart for controlling the service life of a halogen headlamp his company produces. He knows
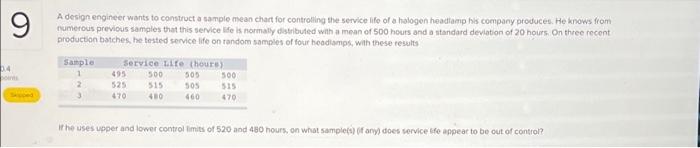
9 A design engineer wants to construct a sample mean chart for controlling the service life of a halogen headlamp his company produces. He knows from numerous previous samples that this service life is normally distributed with a mean of 500 hours and a standard deviation of 20 hours. On three recent production batches, he tested service life on random samples of four headlamps, with these results 0.4 points Skipped Sample 1 2 3 Service Life (hours) 495 525 470 500 515 480 505 505 460 500 515 470 If he uses upper and lower control limits of 520 and 480 hours, on what sample(s) (if any) does service life appear to be out of control?
A design engineer wants to construct a sample mean chart for controling the service lifo of a halogen headtamp his company produces. He knows from fumerous previcus samples that this service ke is normaly distributed with a mean of 500 hours and a standard deviation of 20 hours. On three recent production batches, he tested service life on random samples of four headiamps, whin these results It he uses upper and lower control limits of 520 and 480 hours, on what sample(i) (f ary) does service sfe appeat to be out of control
Step by Step Solution
There are 3 Steps involved in it
1 Expert Approved Answer
Step: 1 Unlock

Question Has Been Solved by an Expert!
Get step-by-step solutions from verified subject matter experts
Step: 2 Unlock
Step: 3 Unlock