

Question: A design engineer wants to construct a sample mean chart for controlling the service life of a halogen head lamp his company produces. He knows
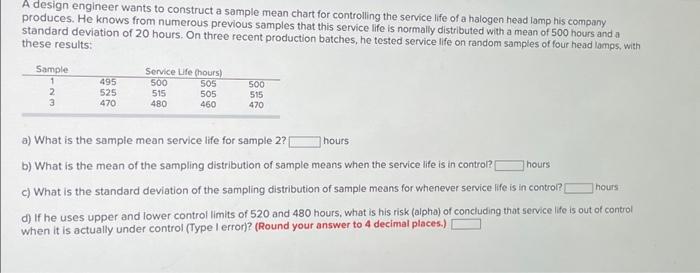
A design engineer wants to construct a sample mean chart for controlling the service life of a halogen head lamp his company produces. He knows from numerous previous samples that this service life is normally distributed wth a mean of 500 hours and a standard deviation of 20 hours. On three recent production batches, he tested service life on random samples of four head lamps, with these results: a) What is the sample mean service life for sample 2 ? hours b) What is the mean of the sampling distribution of sample means when the service life is in control? hours c) What is the standard deviation of the sampling distribution of sample means for whenever service life is in contror? hours d) If he uses upper and lower control limits of 520 and 480 hours, what is his risk (alpho) of concluding that service life is out of control when it is actually under control (Type I error)? (Round your answer to 4 decimal places.)
Step by Step Solution
There are 3 Steps involved in it

Get step-by-step solutions from verified subject matter experts