

Question: 9. Graph A has been completed for you. Please trace over the lines with the appropriate colors. The ELR = 11.C per 1000m The DAR
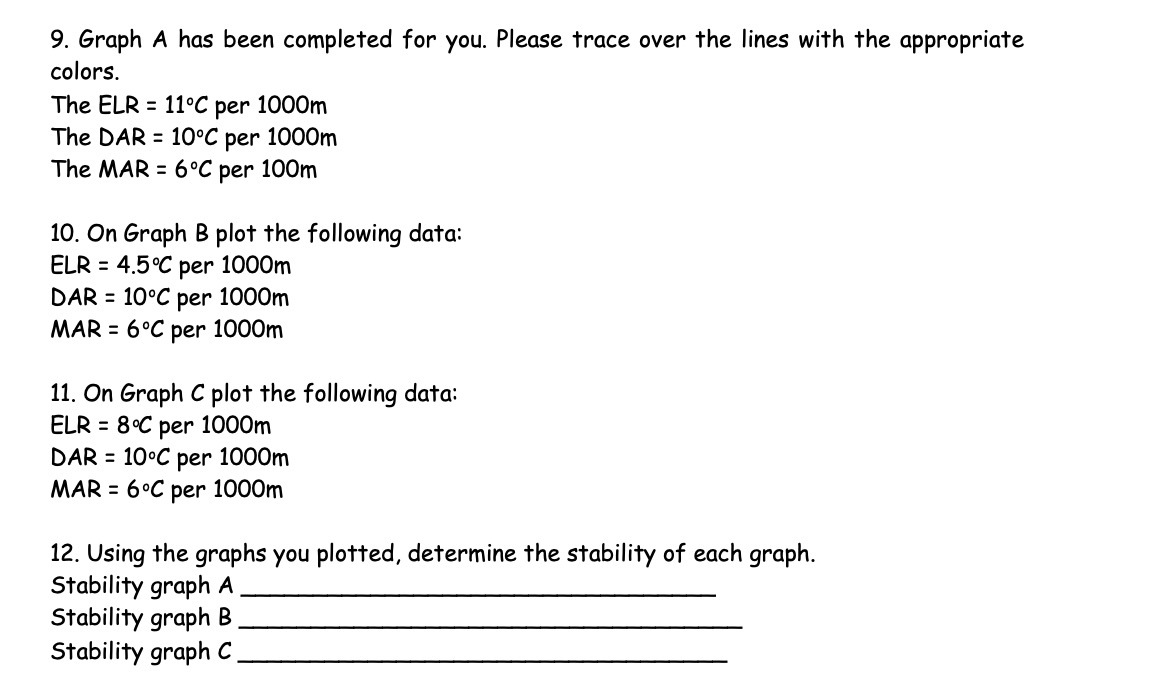
9. Graph A has been completed for you. Please trace over the lines with the appropriate colors. The ELR = 11.C per 1000m The DAR = 10.C per 1000m The MAR = 6.C per 100m 10. On Graph B plot the following data: ELR = 4.5 .C per 1000m DAR = 10 C per 1000m MAR = 6.C per 1000m 11. On Graph C plot the following data: ELR = 8 .C per 1000m DAR = 10 C per 1000m MAR = 6 .C per 1000m 12. Using the graphs you plotted, determine the stability of each graph. Stability graph A Stability graph B Stability graph C
Step by Step Solution
There are 3 Steps involved in it
1 Expert Approved Answer
Step: 1 Unlock

Question Has Been Solved by an Expert!
Get step-by-step solutions from verified subject matter experts
Step: 2 Unlock
Step: 3 Unlock