

Question: 9) The following 20 observations are for two quantitative variables, x and y. (Data File: Scatter) a. Create a scatter chart for these 20 observations.
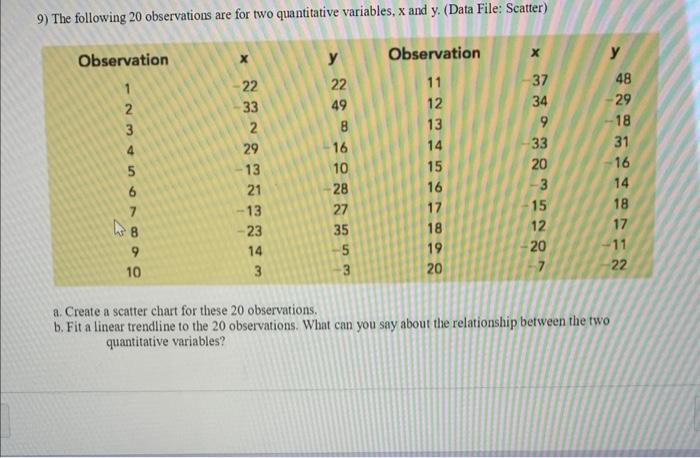
9) The following 20 observations are for two quantitative variables, x and y. (Data File: Scatter) a. Create a scatter chart for these 20 observations. b. Fit a linear trendline to the 20 observations. What can you say about the relationship between the two quantitative variables
Step by Step Solution
There are 3 Steps involved in it
1 Expert Approved Answer
Step: 1 Unlock

Question Has Been Solved by an Expert!
Get step-by-step solutions from verified subject matter experts
Step: 2 Unlock
Step: 3 Unlock