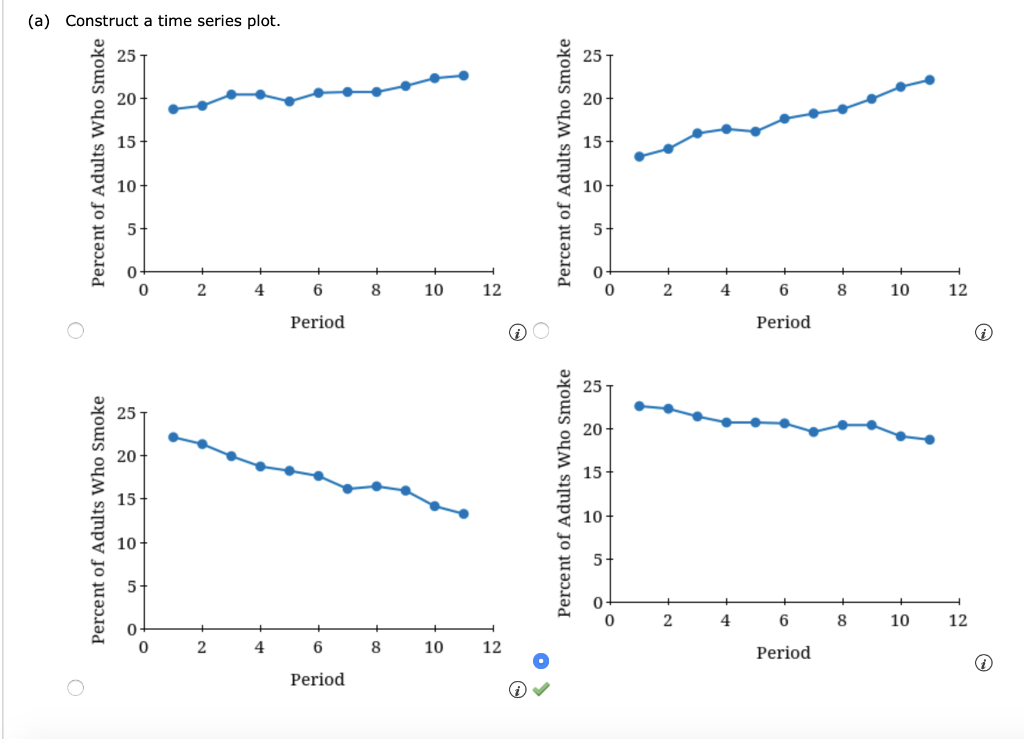
Question: (a) Construct a time series plot. 3 15 Percent of Adults Who Smoke Percent of Adults Who Smoke 10 5 5 0 2 4 9

(a) Construct a time series plot. 3 15 Percent of(a) Construct a time series plot. 3 15 Percent of

(a) Construct a time series plot. 3 15 Percent of Adults Who Smoke Percent of Adults Who Smoke 10 5 5 0 2 4 9 8 10 12 0 2 9 8 10 12 Period Period a Percent of Adults Who Smoke Percent of Adults Who Smoke 10 OT . 0 2. 9 8 10 12 2 8 10 12 Period O Period What type of pattern exists in the data? The time series plot exhibits a cyclical pattern. The time series plot exhibits a horizontal pattern. The time series plot exhibits a trend pattern. The time series plot exhibits a seasonal pattern. (b) Use simple linear regression to find the parameters for the line that minimizes MSE for this time series. (Round your answers to three decimal places.) b1 = bo = (c) One of the agency's goals is to cut the percentage of adults in the United States who were users of tobacco to 12% or less by year 20. Find the forecast of the percent of adults who smoke for year 20. (Round your answer to one decimal place.) o = % 20 Does your regression model from part (b) suggest that the agency is on target to meet this goal? Yes No If not, use your model from part (b) to estimate the year in which the agency will achieve this goal. (Enter 20 if the goal will be met by year 20.)

Step by Step Solution

There are 3 Steps involved in it

1 Expert Approved Answer
Step: 1 Unlock blur-text-image
Question Has Been Solved by an Expert!

Get step-by-step solutions from verified subject matter experts

Step: 2 Unlock
Step: 3 Unlock

Students Have Also Explored These Related General Management Questions!