

Question: A consumer preference study compares the effects of three different bottle designs (A,B, and C) on sales of a popular fabric softener. A completely randomized
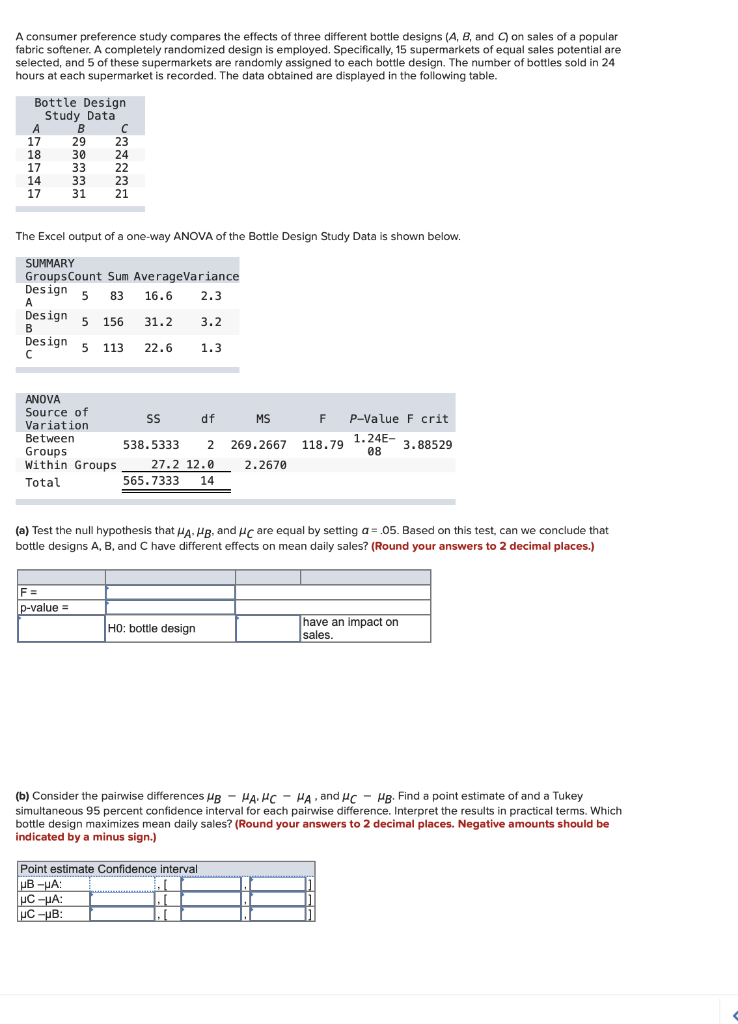
A consumer preference study compares the effects of three different bottle designs (A,B, and C) on sales of a popular fabric softener. A completely randomized design is employed. Specifically, 15 supermarkets of equal sales potential are selected, and 5 of these supermarkets are randomly assigned to each bottle design. The number of bottles sold in 24 hours at each supermarket is recorded. The data obtained are displayed in the following table. The Excel output of a one-way ANOVA of the Bottle Design Study Data is shown below. (a) Test the null hypothesis that A,B, and C are equal by setting =.05. Based on this test, can we conclude that bottle designs A,B, and C have different effects on mean daily sales? (Round your answers to 2 decimal places.) (b) Consider the pairwise differences BACA, and CB. Find a point estimate of and a Tukey simultaneous 95 percent confidence interval for each pairwise difference. Interpret the results in practical terms. Which bottle design maximizes mean daily sales? (Round your answers to 2 decimal places. Negative amounts should be indicated by a minus sign.)
Step by Step Solution
There are 3 Steps involved in it

Get step-by-step solutions from verified subject matter experts