

Question: A consumer preference study compares the effects of three different bottle designs (A, B, and C) on sales of a popular fabric softener. A completely
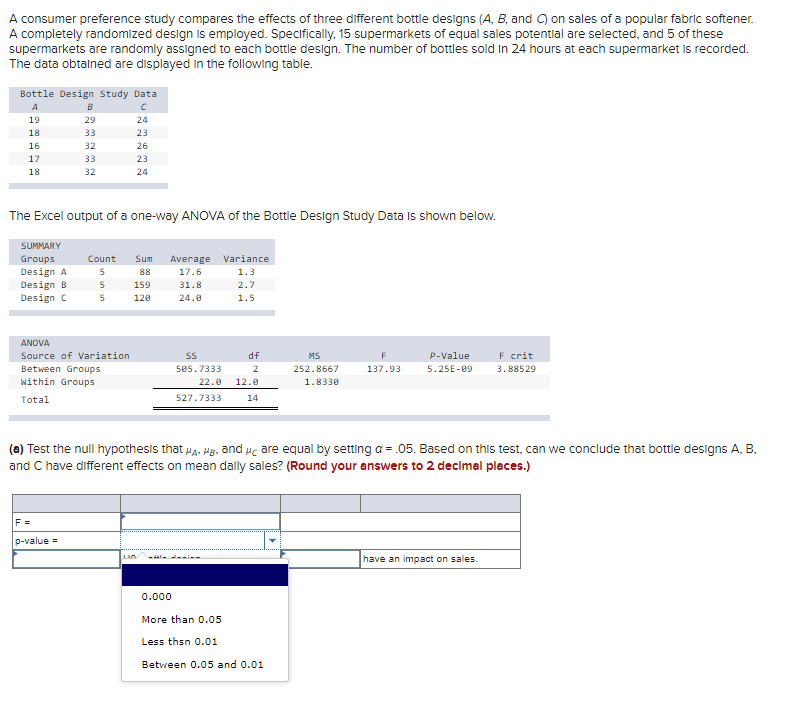
A consumer preference study compares the effects of three different bottle designs (A, B, and C) on sales of a popular fabric softener. A completely randomized design is employed. Specifically, 15 supermarkets of equal sales potential are selected, and 5 of these supermarkets are randomly assigned to each bottle design. The number of bottles sold in 24 hours at each supermarket is recorded. The data obtained are displayed in the following table. Bottle Design Study Data A B C 19 29 24 18 33 23 16 32 26 17 33 23 18 32 24 The Excel output of a one-way ANOVA of the Bottle Design Study Data Is shown below. SUMMARY Groups Count Sum Average Variance Design A 88 17. 6 1.3 Design B 5 159 31.8 2.7 Design C 24.0 1. 5 ANOVA Source of Variation SS df MS P-Value F crit Between Groups 505.7333 252.8667 137.93 5. 25E-89 3. 88529 Within Groups 22.0 12.0 1. 8330 Total 527.7333 14 (a) Test the null hypothesis that MA, MR, and we are equal by setting a = .05. Based on this test, can we conclude that bottle designs A, B, and C have different effects on mean dally sales? (Round your answers to 2 decimal places.) F = p-value = have an impact on sales. 0.000 More than 0.05 Less then 0.01 Between 0.05 and 0.01
Step by Step Solution
There are 3 Steps involved in it

Get step-by-step solutions from verified subject matter experts