

Question: A design engineer wants to construct a sample mean chart for the service life on a new lightbulb. Previous samples revealed that the service life
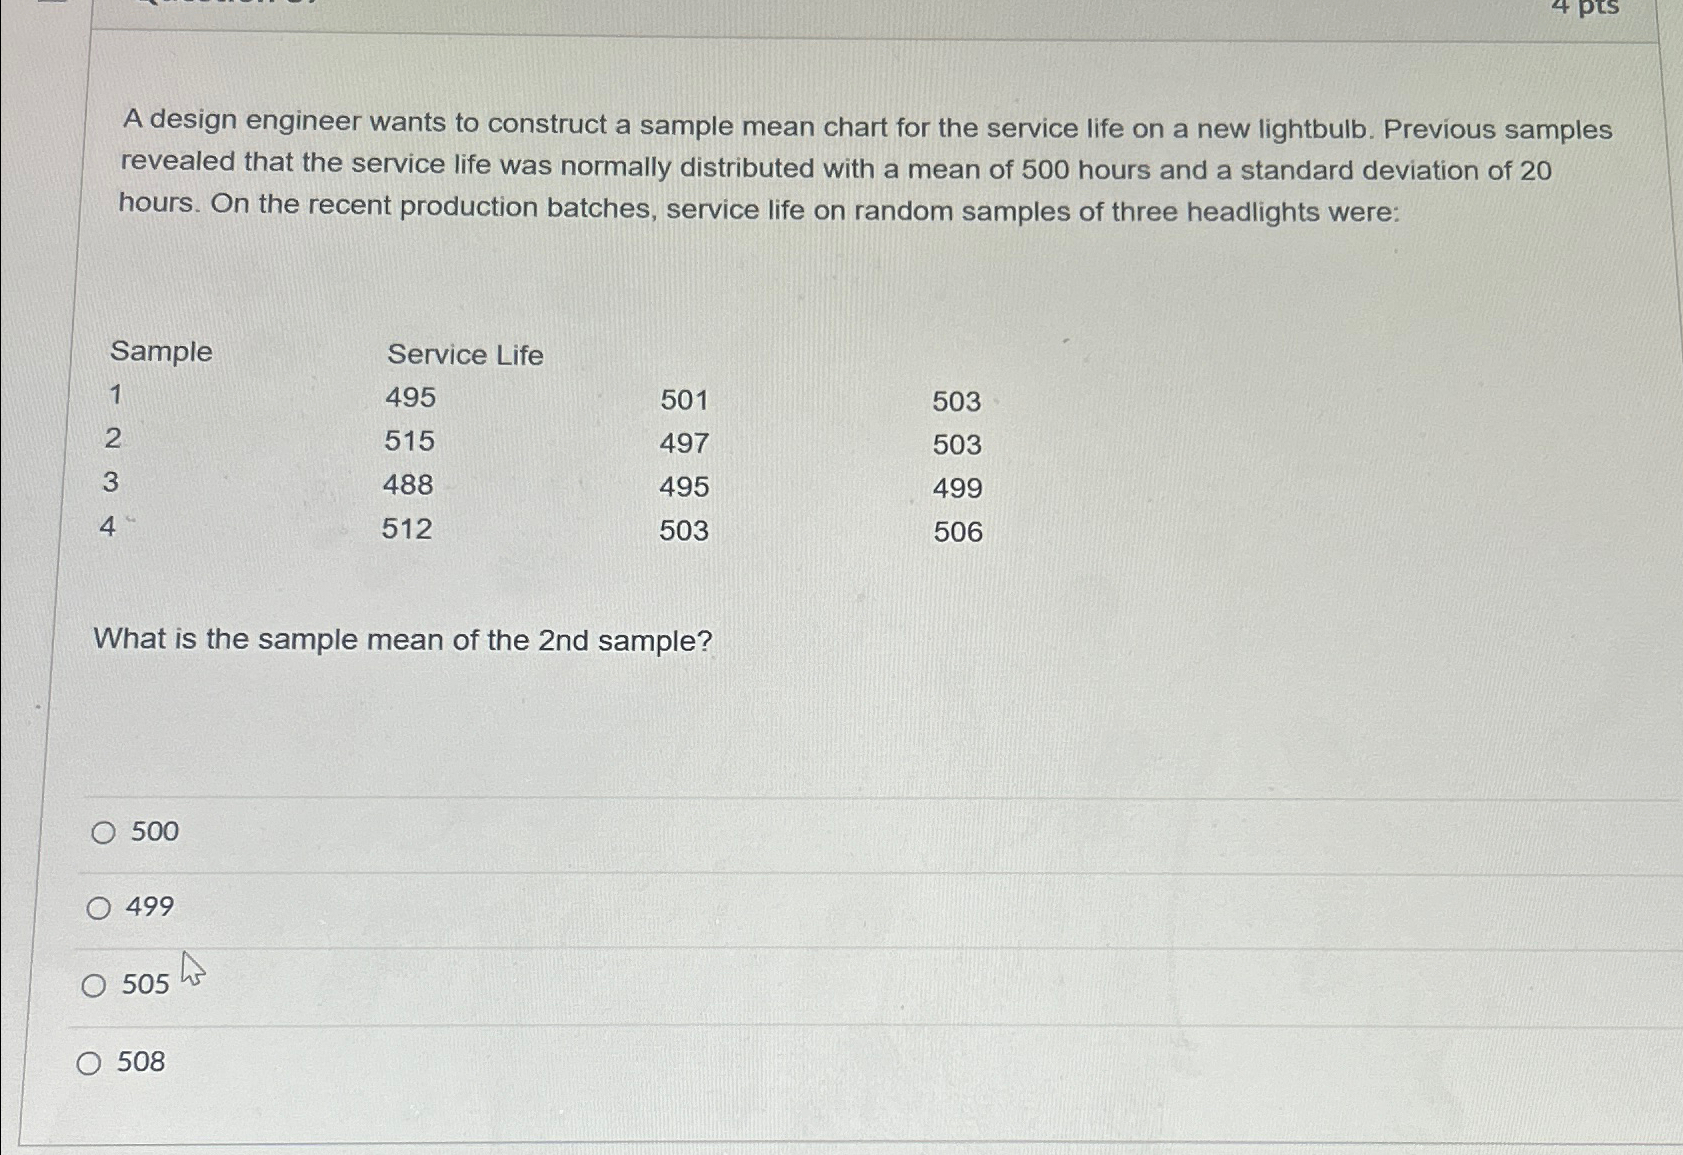
A design engineer wants to construct a sample mean chart for the service life on a new lightbulb. Previous samples revealed that the service life was normally distributed with a mean of hours and a standard deviation of hours. On the recent production batches, service life on random samples of three headlights were:
tableSampleService Life,,
What is the sample mean of the nd sample?
Step by Step Solution
There are 3 Steps involved in it
1 Expert Approved Answer
Step: 1 Unlock

Question Has Been Solved by an Expert!
Get step-by-step solutions from verified subject matter experts
Step: 2 Unlock
Step: 3 Unlock