

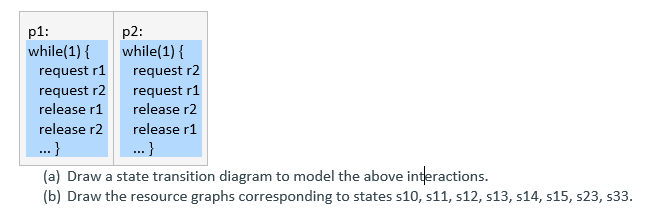
Question: ( a ) Draw a state transition diagram to model the above interactions. ( b ) Draw the resource graphs corresponding to states s 1
a Draw a state transition diagram to model the above interactions.
b Draw the resource graphs corresponding to states s s s s s s s s
Make sure to draw the resource graph for each state listed, not just one of them.
Step by Step Solution
There are 3 Steps involved in it
1 Expert Approved Answer
Step: 1 Unlock

Question Has Been Solved by an Expert!
Get step-by-step solutions from verified subject matter experts
Step: 2 Unlock
Step: 3 Unlock