

Question: A Flow Process Chart is a graphical representation used to document and analyze the steps, activities, and sequences involved in a particular process or workflow.
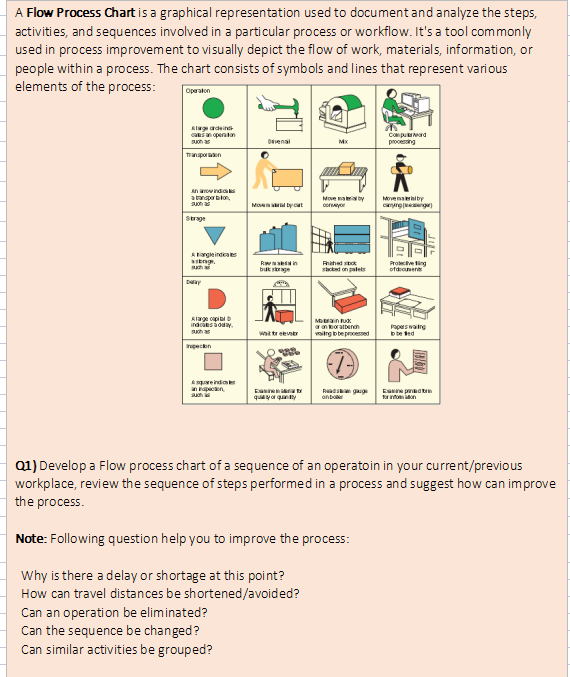
A Flow Process Chart is a graphical representation used to document and analyze the steps, activities, and sequences involved in a particular process or workflow. It's a tool commonly used in process improvement to visually depict the flow of work, materials, information, or people within a process. The chart consists of symbols and lines that represent various elements of the process: Q1) Develop a Flow process chart of a sequence of an operatoin in your current/previous workplace, review the sequence of steps performed in a process and suggest how can improve the process. Note: Following question help you to improve the process: Why is there a delay or shortage at this point? How can travel distances be shortened/avoided? Can an operation be eliminated? Can the sequence be changed? Can similar activities be grouped
Step by Step Solution
There are 3 Steps involved in it

Get step-by-step solutions from verified subject matter experts