

Question: a ) From what we saw in class h ) you should be able to load the daily data and match it to a day
aFrom what we saw in class hyou should be able to load the daily data
and match it to a day since the data began.You can also make an array of all the days covered by the data talland an array with the measurement for each data you have data yallbut there will be days without data. Deciding what to do with the missing data has a big impact on how we interperate our data, particularly if we want to use a Fourier transforms. In class, we tried filling in the missing data with zero, with the overall average, and with interpolated values. None of these worked particularly well, though interpolation did a bit better. One thing you could try is doing some smoothing of the data first, then interpolating to fill in the missing values. This might help get rid of some of the daily noise. Give the a try. Try smoothing somehow, maybe averaging over days or daysthen interpolate on the smoothed data to fill in the missing data. Then try a Fourier transfor and see what the poer spectrum looks like. Is it any cleaner?bOnce you have a decent looking data series, try filtering out low frequencies less than a couple of years?and do an inverse Fourier transform, and see what it looks like. Is the behavior at the end any better?cAnother approach is to try to smooth out the annual and dailyvariationsrather than filter them out. Since we're assuming our data varied on a year timescale, try smoothing on a timescale of a year or more. Maybe a day moving average? Remember not to include the missing data in your smoothing.Find a good smoothing and plot your smoothed data. How does it compare to the filtered data from part bYou can also reduce the number of data points, maybe take monthly or yearly averages rather than trying to fill in data at every point. dLastwe want to use the longterm trend to make some predictions for the future. Fourier transformes of interpolation are probably going to be a bad way to do this, because they tend to vary a lot at the ends, or depend more heavily on the data near the end. That's bad if you're trying to go beyond the end. Instead, you'll probably need to do some sort of fitting. You might try fitting a polynomial or exponential plus polynomial, or some other function. Try fitting to the raw data, and some good smoothed or filtered data. If you're fitting data you've filtered, you might even want to cut off the ends. Pick what fit you think is "best". Then use your fit to make some predictions. What will the COconcentration be in in How good do you think your predictions are? Can you quantify that maybe notDo your predictions start behaving oddly at some pointegdo they start to decrease?
what is wrong with my code?
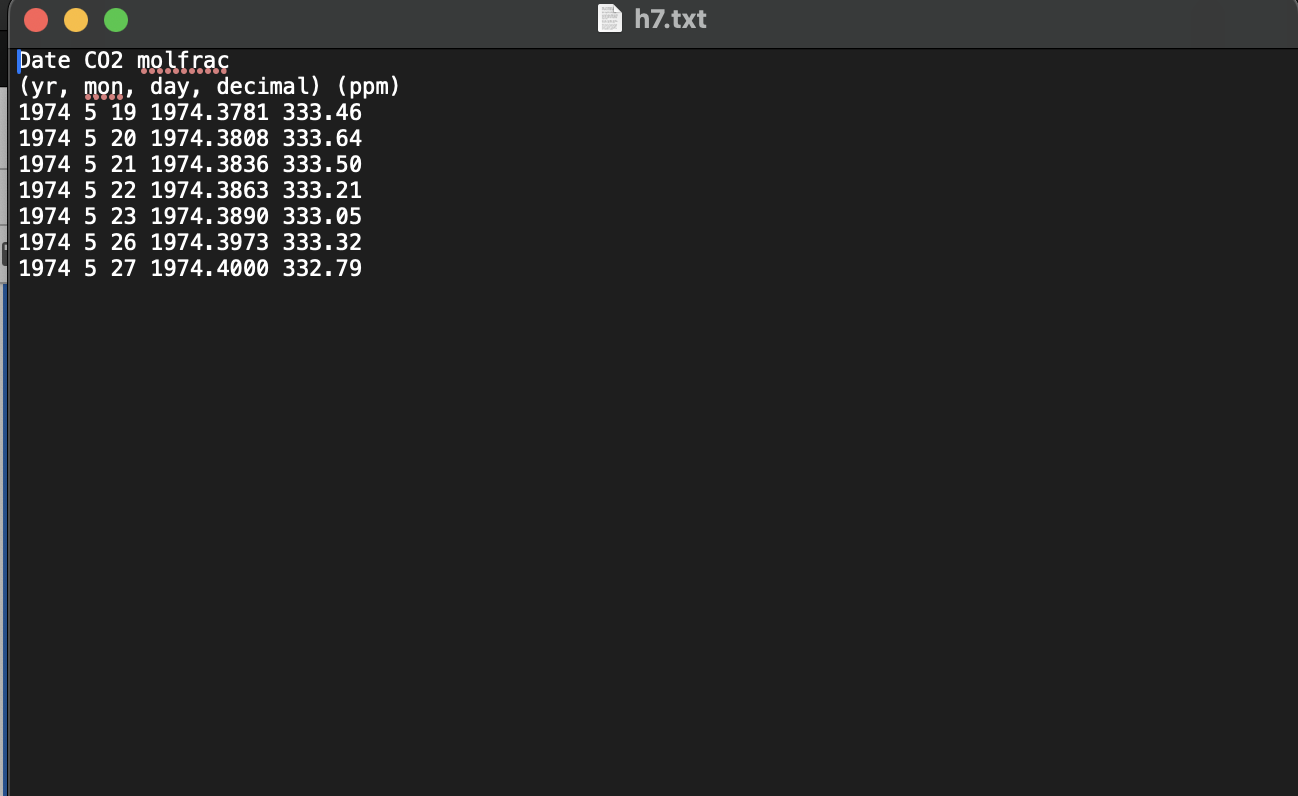
error: KeyError Traceback most recent call last Cell In line printdatahead # Step : Convert Date Columns and Calculate Days Since Start # Convert yr 'mon', and 'day' columns into a single date column startdate pdtodatetimedatayr 'mon', 'day'iloc datadate pdtodatetimedatayr 'mon', 'day' datadayssincestart'datadate startdatedtdays File optanacondalibpythonsitepackagespandascoreframepy: in DataFrame.getitemself key if isiteratorkey: key listkey indexer self.columns.getindexerstrictkey "columns" # take does not accept boolean indexers if getattrindexer "dtype", None bool: File optanacondalibpythonsitepackagespandascoreindexesbasepy: in Index.getindexerstrictself key, axisname else: keyarr, indexer, newindexer self.reindexnonuniquekeyarr self.raiseifmissingkeyarr indexer, axisname keyarr self.takeindexer if isinstancekey Index: # GH Preserve name from an Index File optanacondalibpythonsitepackagespandascoreindexesbasepy: in Index.raiseifmissingself key, indexer, axisname if nmissing: if nmissing lenindexer: raise KeyErrorfNone of key are in the axisname notfound listensureindexkeymissingmask.nonzerounique raise KeyErrorfnotfound not in index" KeyError: "None of Indexyr 'mon', 'day' dtype'object' are in the columns
Step by Step Solution
There are 3 Steps involved in it
1 Expert Approved Answer
Step: 1 Unlock

Question Has Been Solved by an Expert!
Get step-by-step solutions from verified subject matter experts
Step: 2 Unlock
Step: 3 Unlock