

Question: A ) Given the following temperature and pressures for C O 2 , plot the isotherm on a P - V diagram, indicating the phase
A Given the following temperature and pressures for plot the isotherm on a diagram,
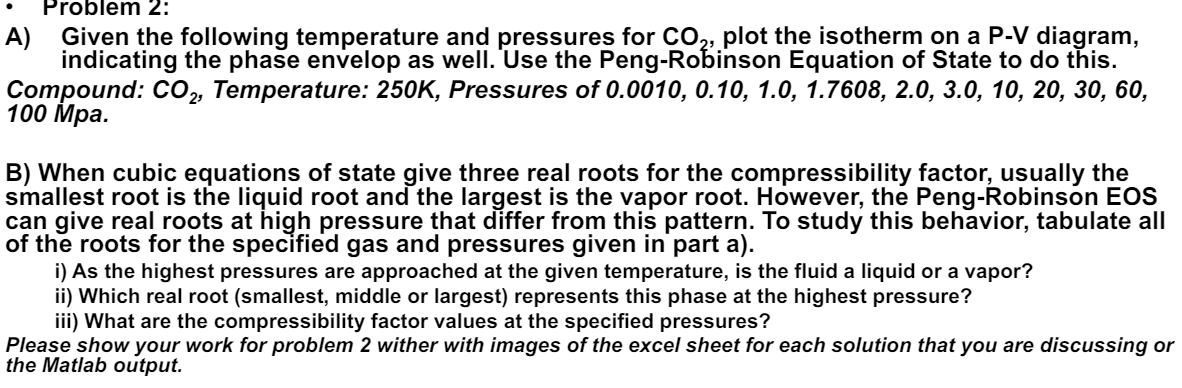
indicating the phase envelop as well. Use the PengRobinson Equation of State to do this.
Compound: Temperature: K Pressures of
Mpa.
B When cubic equations of state give three real roots for the compressibility factor, usually the
smallest root is the liquid root and the largest is the vapor root. However, the PengRobinson EOS
can give real roots at high pressure that differ from this pattern. To study this behavior, tabulate all
of the roots for the specified gas and pressures given in part a
i As the highest pressures are approached the given temperature, is the fluid a liquid or a vapor?
ii Which real root smallest middle or largest represents this phase at the highest pressure?
iii What are the compressibility factor values at the specified pressures?
Please show your work for problem wither with images of the excel sheet for each solution that you are discussing or
the Matlab output.
Step by Step Solution
There are 3 Steps involved in it
1 Expert Approved Answer
Step: 1 Unlock

Question Has Been Solved by an Expert!
Get step-by-step solutions from verified subject matter experts
Step: 2 Unlock
Step: 3 Unlock