

Question: A Insert Table Chart Text Shape Media Comment 5. Using the data set Problem Set 8 Data Set found on Canvas, compute a 2-tailed independent-samples
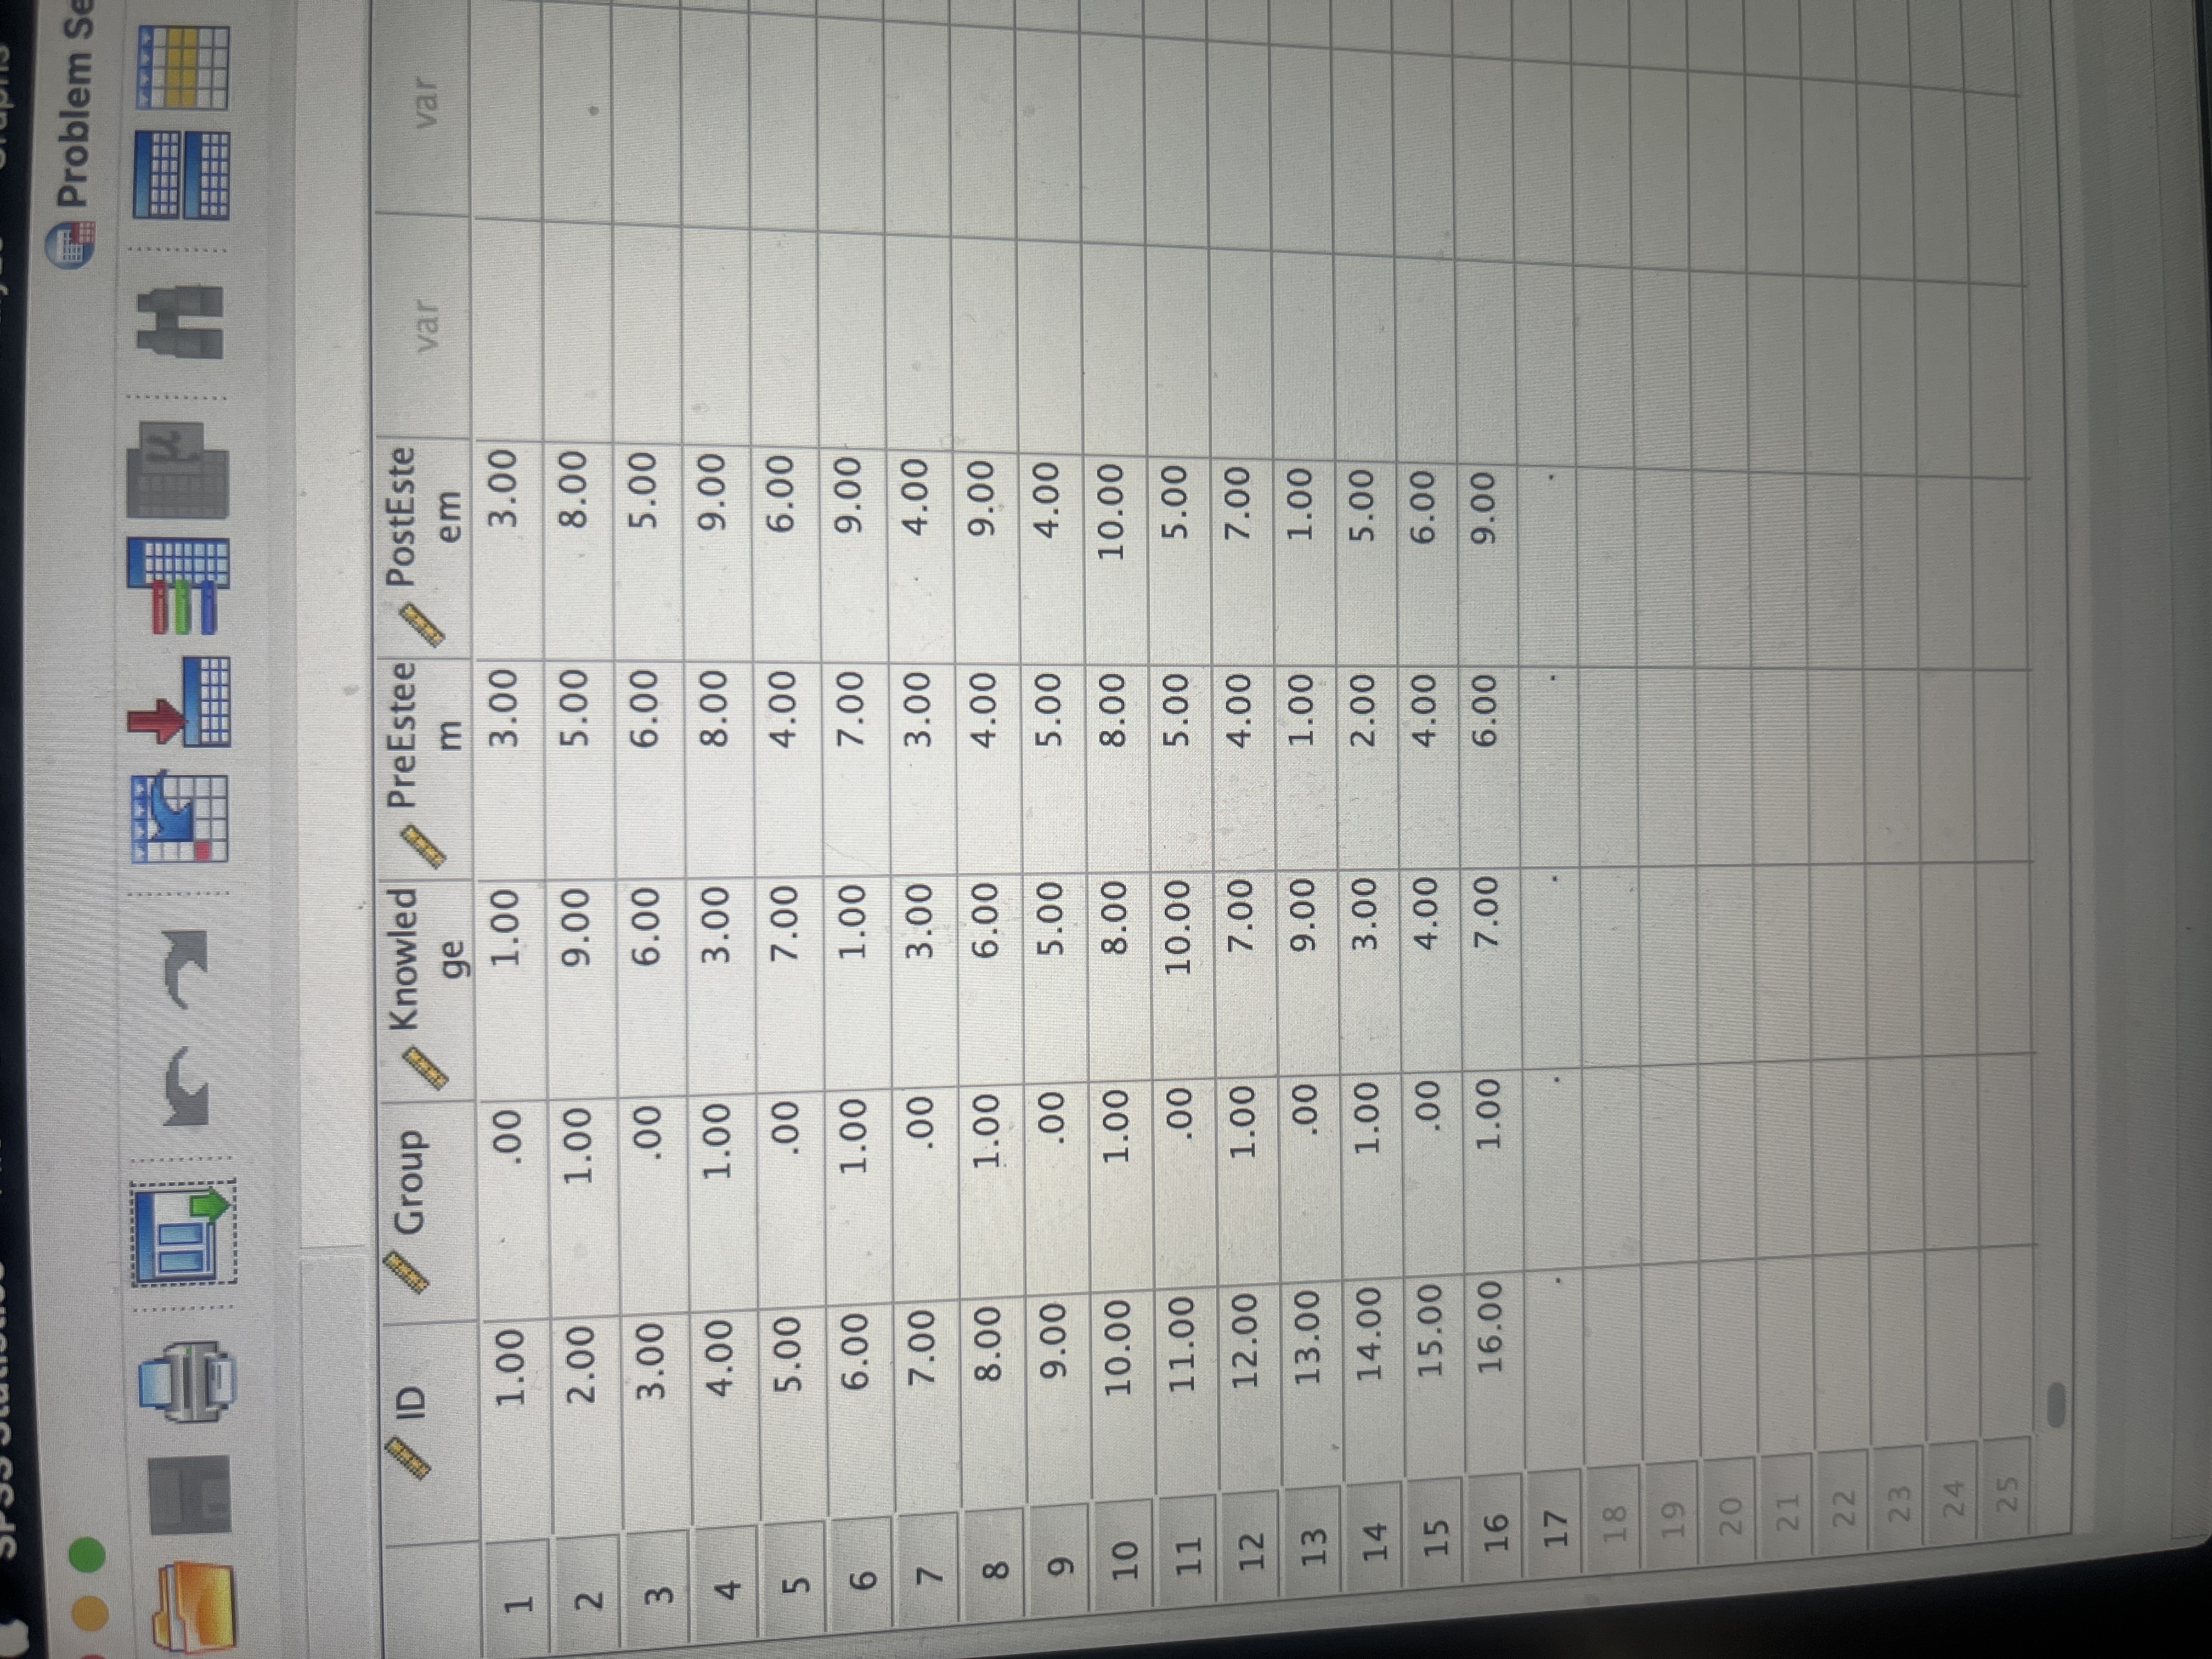
A Insert Table Chart Text Shape Media Comment 5. Using the data set "Problem Set 8 Data Set" found on Canvas, compute a 2-tailed independent-samples t test with a significance level of a = .05 using "group" as the grouping variable (groups are coded 0 and 1) and "knowledge" as the dependent variable. For credit, be sure to include your output. (3 points - 2 points for getting the correct output and 1 point for including the output)| 6. Using the output from question 5, report the results of the independent-samples t test. Use the proper notation including the degrees of freedom, sample statistic (aka observed value), and p value. Also report the 95% confidence interval. Use three decimal places (more technically, round to the thousandths). HINT: Remember results often differ depending if variances are equal or not equal between groups. Be sure to interpret the correct lines of output depending on the significance of Levene's test. (1 point - for all correct answers).\f
Step by Step Solution
There are 3 Steps involved in it

Get step-by-step solutions from verified subject matter experts