

Question: a) List the forecast for week 7 and 8 b) Explain the method or logic used for this forecast Understand Forecasting Review the actual demand
a) List the forecast for week 7 and 8
Understand Forecasting Review the actual demand for the six weeks, in the table below. For that, I suggest that you draw (for yourself) a graph/chart of the actual demand, where the weeks are on the X Axis and the actual demand is on the Y Axis. Understand the pattern of the demand. (10 marks) Actual Demand Week Actual Demand Week 1 20 Forecast Week 2 25 Week 3 27 XXXXXX XXXXXX XXXXXX XXXXXX XXXXXX XXXXXX XXXXXX XXXXXX XXXXXX XXXXXX XXXXXX XXXXXX 28 Week 4 Week 35 40 Week 6 Week 7 Week 8 a List the forecast for Week 7 and for Week 8 (6 marks) b) Explain the method or logic used for this forecast 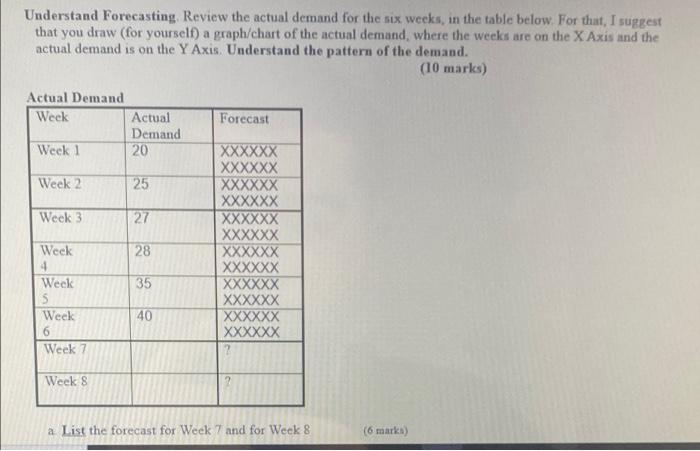
Step by Step Solution
There are 3 Steps involved in it
1 Expert Approved Answer
Step: 1 Unlock

Question Has Been Solved by an Expert!
Get step-by-step solutions from verified subject matter experts
Step: 2 Unlock
Step: 3 Unlock