

Question: A manager wishes to build a 3-sigma range chart for a process. The sample size is five, the mean of sample means is 28.5, and
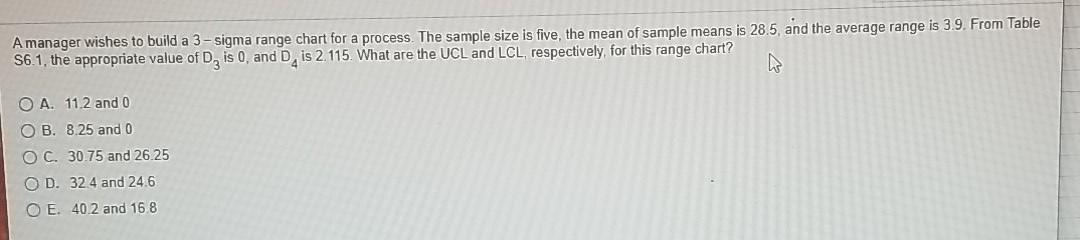
A manager wishes to build a 3-sigma range chart for a process. The sample size is five, the mean of sample means is 28.5, and the average range is 3.9. From Table S6.1, the appropriate value of D, is 0, and D, is 2.115. What are the UCL and LCL, respectively, for this range chart? OA. 11.2 and 0 OB. 8.25 and 0 O C. 30.75 and 26.25 OD. 32.4 and 24.6 O E 40.2 and 16.8
Step by Step Solution
There are 3 Steps involved in it
1 Expert Approved Answer
Step: 1 Unlock

Question Has Been Solved by an Expert!
Get step-by-step solutions from verified subject matter experts
Step: 2 Unlock
Step: 3 Unlock