

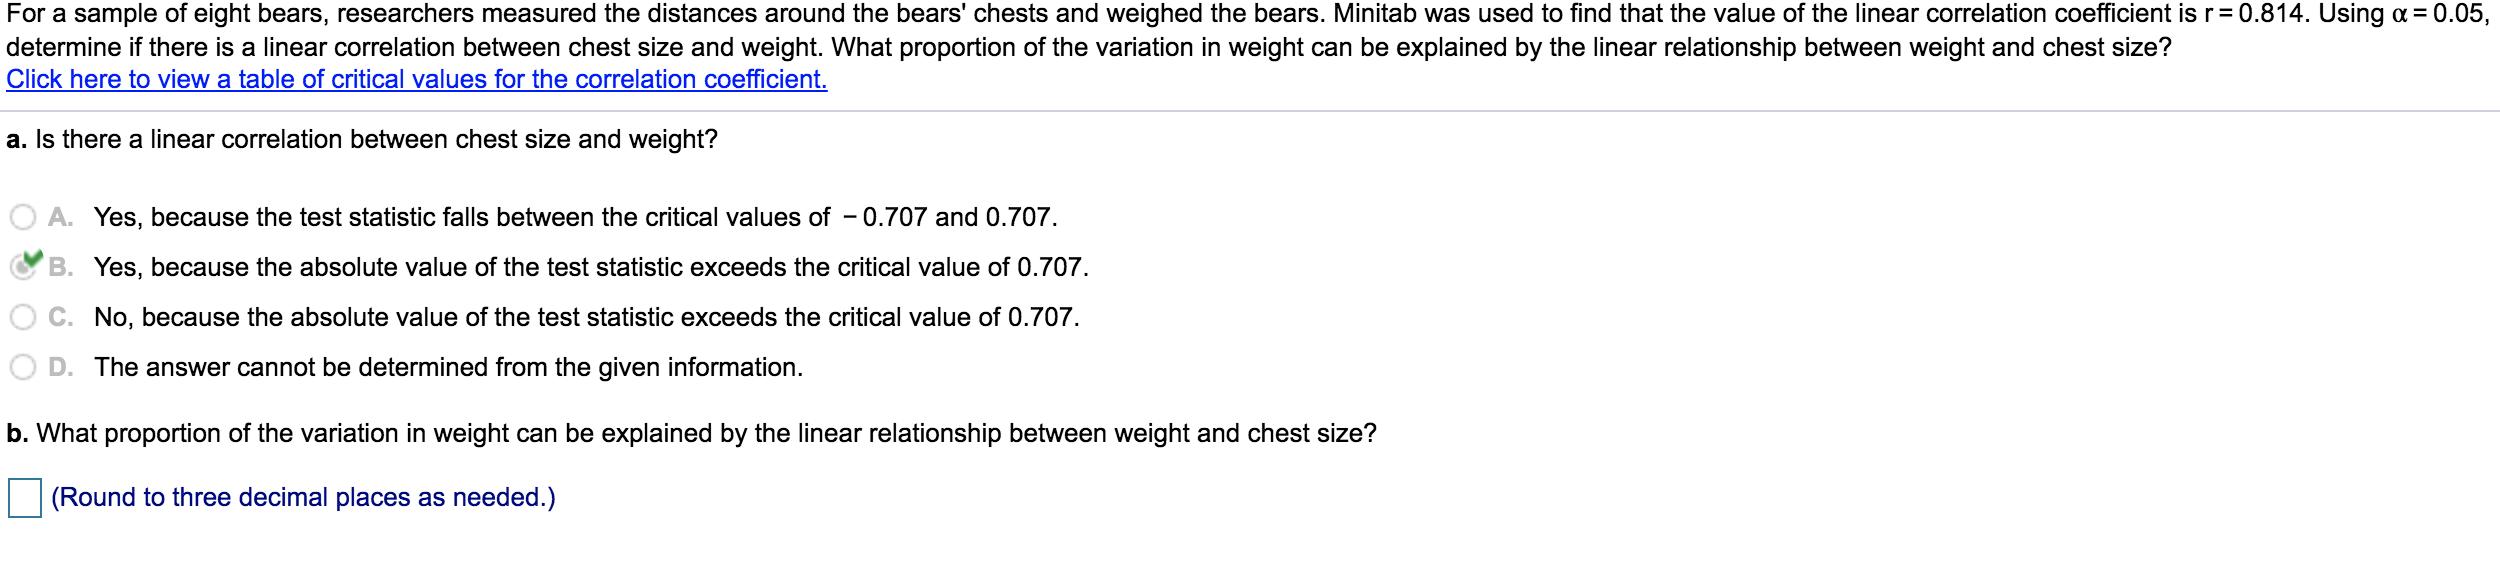
For a sample of eight bears, researchers measured the distances around the bears' chests and weighed...
Fantastic news! We've Found the answer you've been seeking!
Question:
Expert Answer:

Related Book For 
Marketing The Core
ISBN: 978-0078028922
5th edition
Authors: Roger A. Kerin, Steven W. Hartley, William Rudelius
Posted Date:
