

Question: A natural gas processing company has had problems in its distribution channel and% of defective products. The containers they use to distribute are transportation tanks
A natural gas processing company has had problems in its distribution channel and% of defective products. The containers they use to distribute are transportation tanks fed by pipes by land and sea, distributed by trucks. The company's gas production, transmission and distribution process is mapped in the following image:
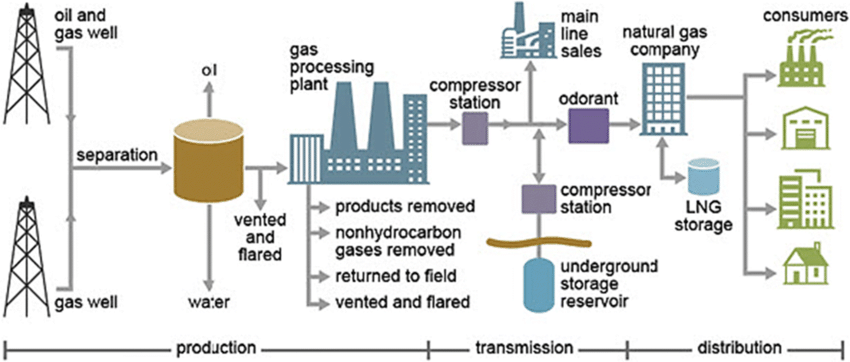
Makes a flow chart of the gas production process until it is delivered to the end customers. The leader of the high performance team of the quality area carried out a root cause analysis with his work team and the following causes resulted from it: 1. Preparation of services (electricity, hot water, etc.). 2. Low inventory levels. 3. Remove inventory directly from the pipe without an eviction order. 4. Specific volume not met. 5. Incorrect reading of scales. 6. Incorrect sequence of invoices. 7. Lack of coordination between forklifts. 8. Failure to prepare equipment before starting work. 9. Unusual worker behavior. 10. Poor tools and equipment. 11. Order registered in a confusing or illegible way. 12. Poor working conditions (e.g. weather).
Make a diagram to visualize precisely and grouped the causes (Minitab)
Continuing with the root cause analysis, the leader collected the following information:
Table 2. Frequency of errors per cause.
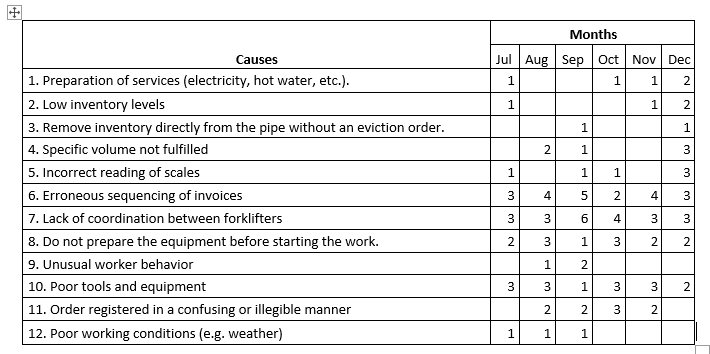
- Develop a diagram that helps to better visualize the causes with their frequency and analyze: What conclusion would you present to the work team?
To counteract the first problem (Preparation of services)it is hypothesized that the sealing temperature of the packer, the temperature of the cooling bar and the gas not suitable in the mixture are related to each other and cause a large part of the defects. We have the following data:
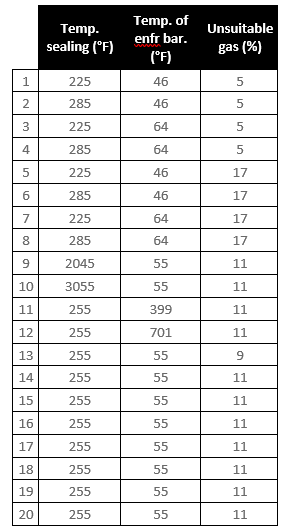
- Develop an analysis to define the relationship between the variables.What practical conclusion would you present to the team?
oil and gas well consumers main line sales natural gas company ol gas processing plant compressor station odorant separation compressor station LNG storage vented and flared products removed nonhydrocarbon gases removed returned to field vented and flared no underground storage reservoir gas well wa:er production transmission distribution Months Jul Aug Sep Oct Nov Dec 1 1 1 2 1 1 2 1 1 2 1 3 1 1 1 3 vo Causes 1. Preparation of services (electricity, hot water, etc.). 2. Low inventory levels 3. Remove inventory directly from the pipe without an eviction order. 4. Specific volume not fulfilled 5. Incorrect reading of scales 6. Erroneous sequencing of invoices 7. Lack of coordination between forklifters 8. Do not prepare the equipment before starting the work. 9. Unusual worker behavior 10. Poor tools and equipment 11. Order registered in a confusing or illegible manner 12. Poor working conditions (e.g. weather) 3 4 5 2 4 3 3 6 4 Nm 3 3 NW 2 1 3 2 2 mmm NANO 2 3 3 1 3 3 2 mm Nw 2 2 3 2 | 1111111 Temp. sealing (F) Temp. of enfr bar. (F) Unsuitable gas (%) 1 225 46 5 2 285 46 5 3 225 64 5 4 285 64 5 5 225 46 17 6 285 46 17 7 225 64 17 8 285 64 17 9 2045 55 11 10 3055 55 11 11 255 399 11 12 255 701 11 13 255 55 9 14 255 55 11 15 255 55 11 16 255 55 11 17 255 55 11 18 255 55 11 19 255 55 11 20 255 55 11
Step by Step Solution
There are 3 Steps involved in it

Get step-by-step solutions from verified subject matter experts