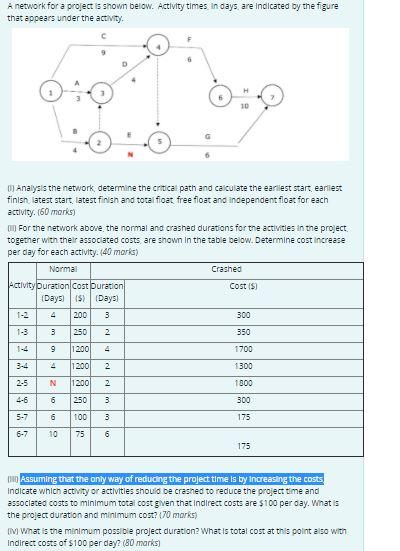
Question: A network for a project is shown below. Activity times in days are indicated by the figure that appears under the activity. 9 Pipe 0:4

A network for a project is shown below. Activity

A network for a project is shown below. Activity times in days are indicated by the figure that appears under the activity. 9 Pipe 0:4 Analysis the network, determine the critical path and calculate the earliest start earliest finish iatest start latest finish and total float free float and independent float for each activity. 160 marks) DU For the network above the normal and crashed durations for the activities in the project. together with their associated costs are shown in the table below. Determine cost increase per day for each activity. (40 marks) Normal Crashed -ctivity Duration Cost Duration Cost ISI (Days (5) Days 4 200 3 300 1-3 3 250 2. 350 1200 2 1700 3-4 4 2 1300 1200 1200 2-5 N 2 1800 4-6 6 250 3 300 5.7 6 100 3 175 6-7 10 75 6 175 Assuming that the only way of reducing the project time is by increasing the costs Indicate which activity or activities should be crashed to reduce the project time and associated costs to minimum total cost given that indirect costs are $100 per day. What is the project duration and minimum cost? (70 marks) IM What is the minimum possible project duration? What is total cost at this point also with Indirect costs of 100 per day? (80 marks)

Step by Step Solution

There are 3 Steps involved in it

1 Expert Approved Answer
Step: 1 Unlock blur-text-image
Question Has Been Solved by an Expert!

Get step-by-step solutions from verified subject matter experts

Step: 2 Unlock
Step: 3 Unlock

Students Have Also Explored These Related General Management Questions!