

Question: (a) Plot the data on airplane shipments. Plot A Plot B Plot C Plot D US Aviation Quarterly Shipments (2009-2015) US Aviation Quarterly Shipments
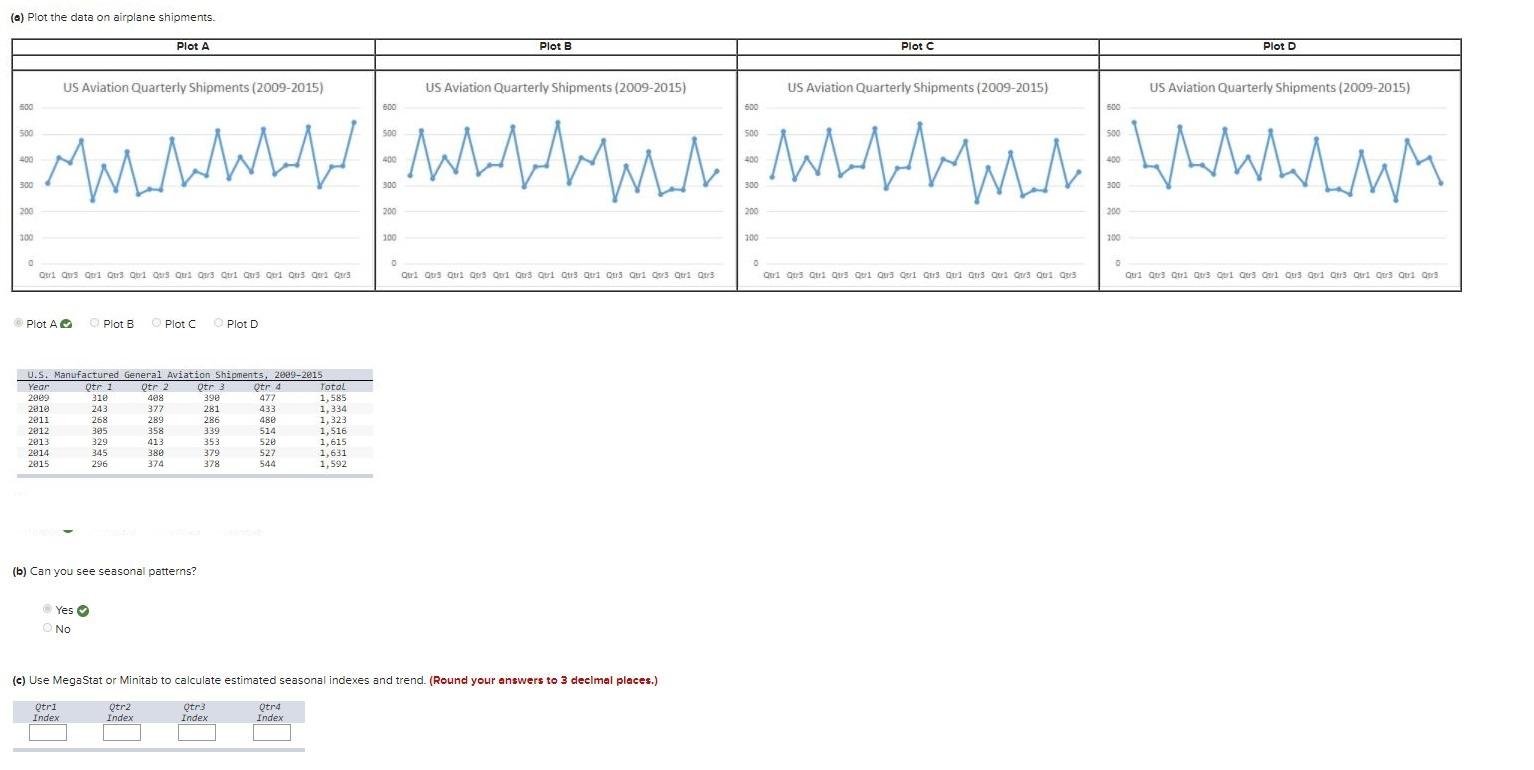
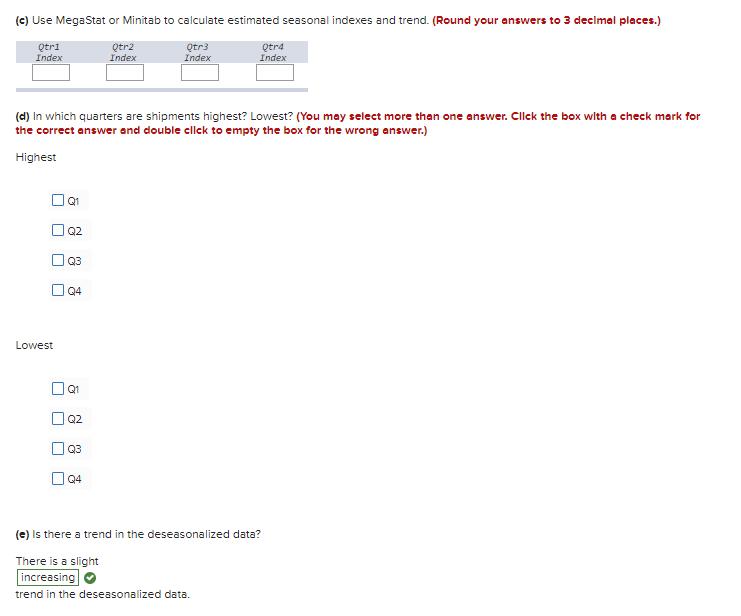

(a) Plot the data on airplane shipments. Plot A Plot B Plot C Plot D US Aviation Quarterly Shipments (2009-2015) US Aviation Quarterly Shipments (2009-2015) US Aviation Quarterly Shipments (2009-2015) US Aviation Quarterly Shipments (2009-2015) 500 600 500 600 500 S00 500 500 400 400 400 400 300 300 300 300 200 200 200 200 100 100 100 100 Qtri Qus Qui Qus Qu1 Qers Qui Qar3 Qtri Qu3 Ql Qus Qtra Qua Qui Qus Qtri Qus Qri Qu3 Qui Qtr3 Qtri Qtrs Qri Q3 Qtri Qtr3 Qui Qus Qtrl Qt3 Qi Qr3 Qel Qu3 Op1 Qtr3 Qtrl Qu Qtri Ors Plot AO O Plot B O Plot C O Plot D U.S. Manufactured General Aviation Shipments, 2009-2015 Totol 1,585 1,334 1,323 1,516 1,615 1,631 1,592 Qtr 1 310 243 Qtr 3 390 Qtr 4 477 Year Qtr 2 2009 408 2810 377 281 433 2011 268 289 286 480 2012 305 358 339 514 2013 329 413 353 520 2014 345 380 379 527 2015 296 374 378 544 (b) Can you see seasonal patterns? Yes O O No (c) Use MegaStat or Minitab to calculate estimated seasonal indexes and trend. (Round your answers to 3 decimal places.) Qtri Index Qtr2 Qtr3 Tndey Qtra Index Index Index (c) Use MegaStat or Minitab to calculate estimated seasonal indexes and trend. (Round your answers to 3 decimal places.) Qtri Index Qtr2 Index Qtr3 Index Qtr4 Index (d) In which quarters are shipments highest? Lowest? (You may select more than one answer. Clck the box with a check mark for the correct answer and double cllck to empty the box for the wrong answer.) Highest O Q2 OQ3 O Q4 Lowest Q1 O Q2 Q3 O 04 (e) Is there a trend in the deseasonalized data? There is a slight increasing trend in the deseasonalized data. U.S. Manufactured General Aviation Shipments, 2009-2015 Year Qtr 1 Qtr 2 Qtr 3 Qtr 4 Total Year Qtr Planes 1,585 1,334 2009 310 408 390 477 2009 Qtr1 310 2010 243 377 281 433 Qtr2 408 2011 268 289 286 480 1,323 Qtr3 390 2012 305 358 339 514 1,516 Qtr4 477 2013 2014 329 413 353 520 1,615 2010 Qtr1 243 345 380 379 527 1,631 Qtr2 377 2015 296 374 378 544 1,592 Qtr3 281 Qtr4 433 2011 Qtr1 268 LearningStats Qtr2 289 Qtr3 286 Copyright 2019 by The McGraw-Hill Companies Qtr4 480 2012 Qtr1 305 Qtr2 358 This spreadsheet is intended solely for educational purposes by Qtr3 339 licensed users of Connect Qtr4 514 2013 Qtr1 329 Qtr2 413 Qtr3 353 Source: General Aviation Manufacturers Association (www.gama.aero). Quarterly shipments may not add to annual total because some manufacturers only report annual totals. Qtr4 520 2014 Qtr1 345 Qtr2 380 Qtr3 379 Qtr4 527 2015 Qtr1 296 Qtr2 Qtr3 374 378 Qtr4 544
Step by Step Solution
3.42 Rating (146 Votes )
There are 3 Steps involved in it

Get step-by-step solutions from verified subject matter experts