

Question: a) Plot this, + - (EXT.)) ult+To) (se -To >Y )=(!) Plot this frequency response with MATLAB. a) Plot this, + - (EXT.)) ult+To) (se
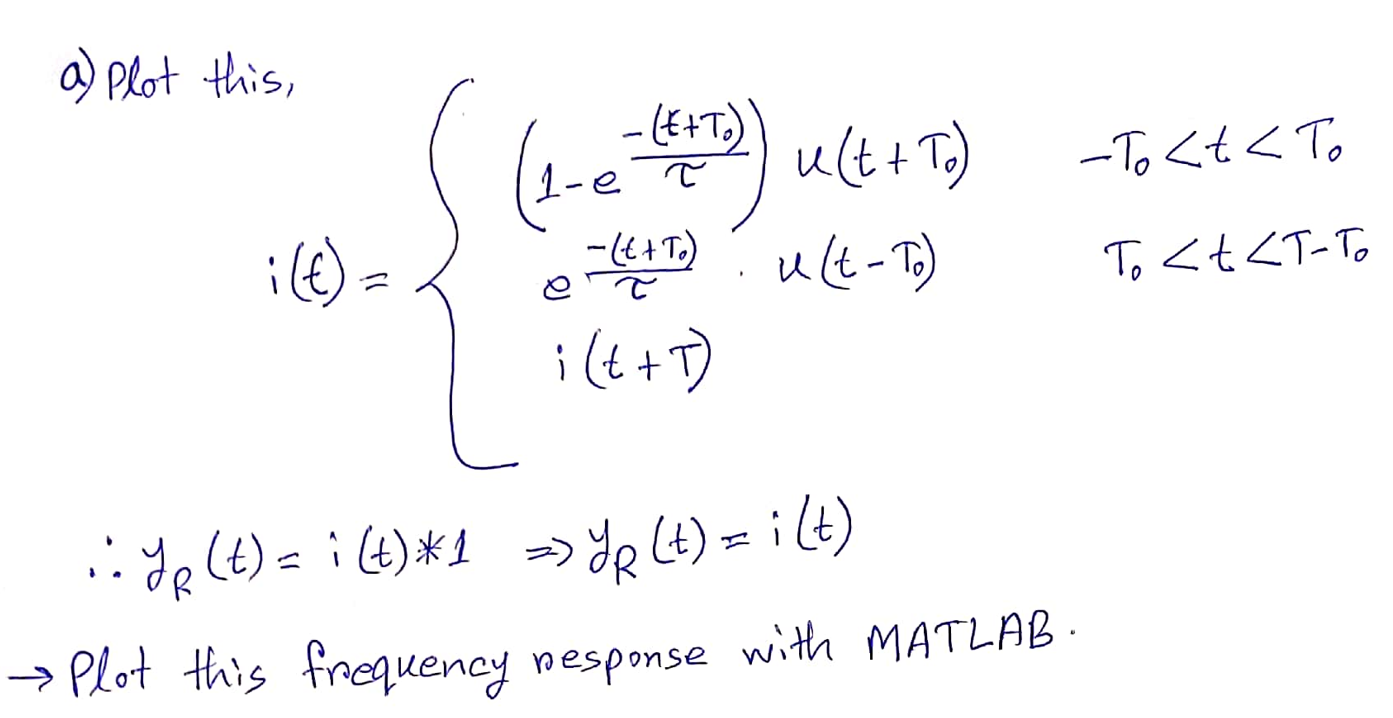
a) Plot this, + - (EXT.)) ult+To) (se -To
Step by Step Solution
There are 3 Steps involved in it
1 Expert Approved Answer
Step: 1 Unlock

Question Has Been Solved by an Expert!
Get step-by-step solutions from verified subject matter experts
Step: 2 Unlock
Step: 3 Unlock