

Question: A process sampled 2 0 times with a sample of size 8 resulted in ? b a r ( x ) = 2 8 .
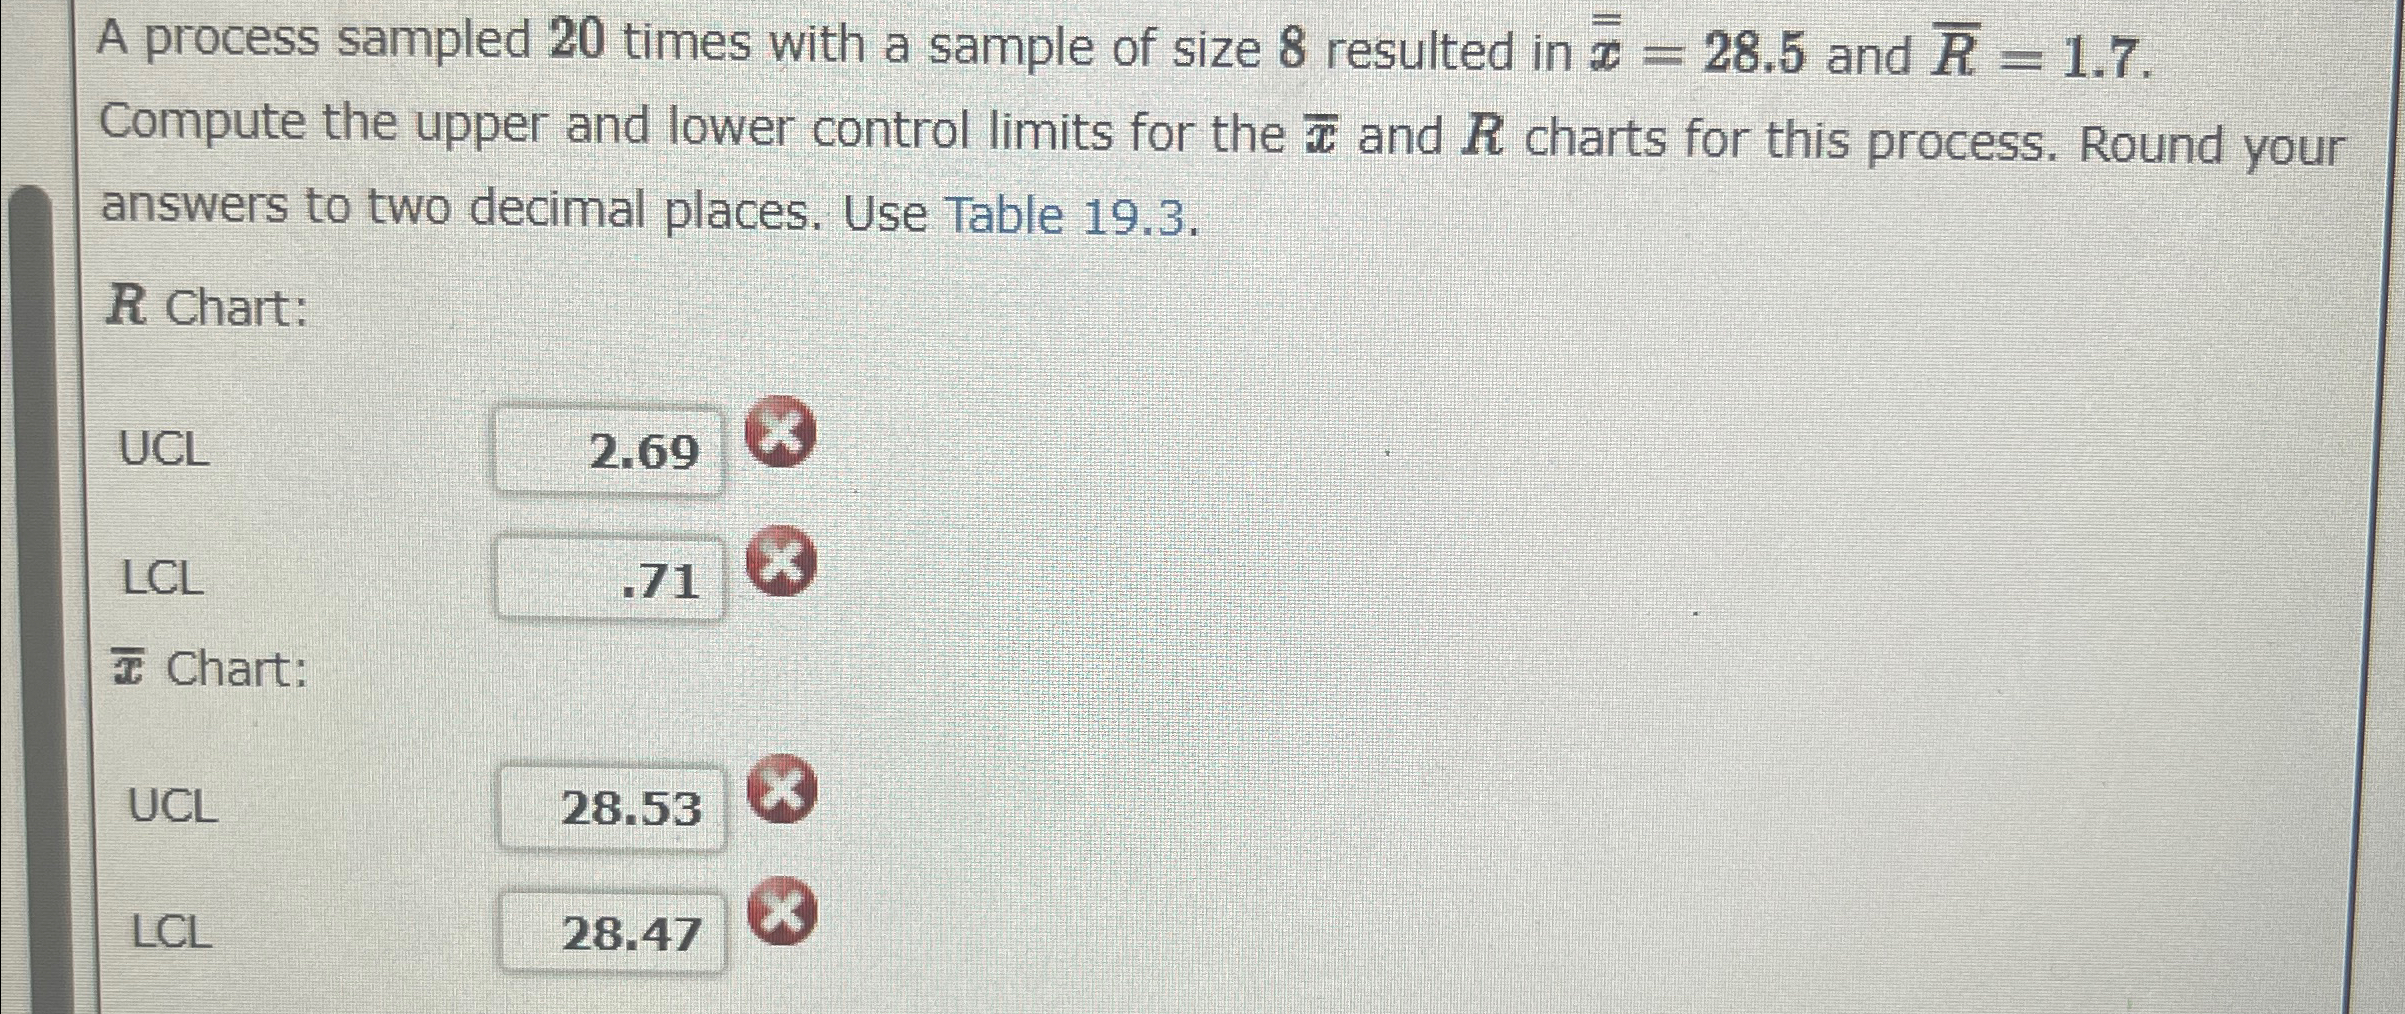
A process sampled times with a sample of size resulted in and Compute the upper and lower control limits for the and charts for this process. Round your answers to two decimal places. Use Table
Chart:
tableUCLLCL Chart:,
UCL
LCL
Step by Step Solution
There are 3 Steps involved in it
1 Expert Approved Answer
Step: 1 Unlock

Question Has Been Solved by an Expert!
Get step-by-step solutions from verified subject matter experts
Step: 2 Unlock
Step: 3 Unlock