

Question: A Quality Analyst wants to construct a control chart for determining whether three machines, all producing the same product, are under control with regard to
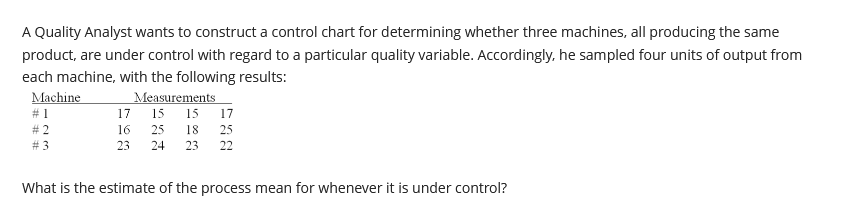
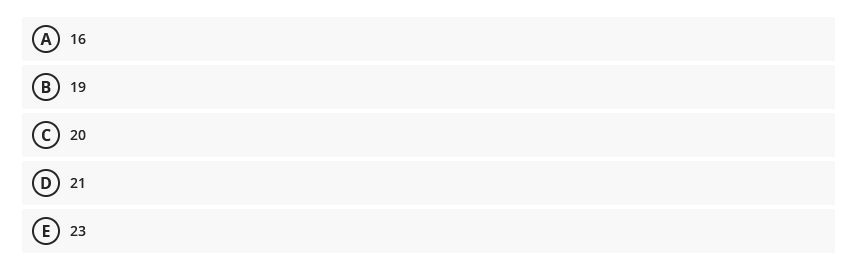
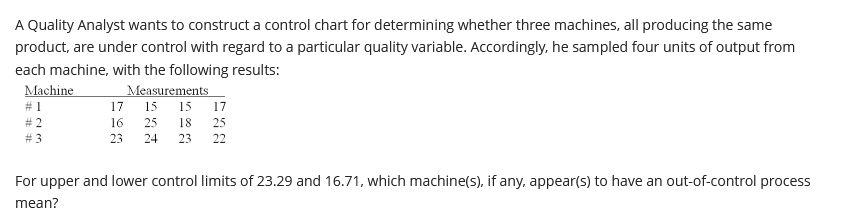
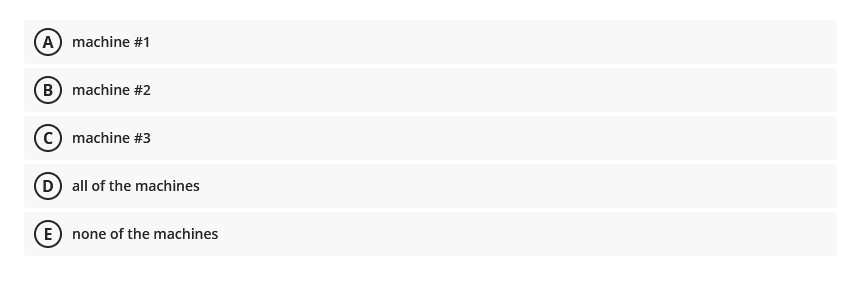
A Quality Analyst wants to construct a control chart for determining whether three machines, all producing the same product, are under control with regard to a particular quality variable. Accordingly, he sampled four units of output from each machine, with the following results: What is the estimate of the process mean for whenever it is under control? 16 (B) 19 (C) 20 (D) 21 (E) 23 A Quality Analyst wants to construct a control chart for determining whether three machines, all producing the same product, are under control with regard to a particular quality variable. Accordingly, he sampled four units of output from each machine, with the following results: For upper and lower control limits of 23.29 and 16.71, which machine(s), if any, appear(s) to have an out-of-control process mean? machine \#1 (B) machine \#2 (C) machine \#3 (D) all of the machines (E) none of the machines The following data occurs chronologically from left to right: 15.219.716.011.114.814.5 The number of runs with respect to the sample median is: 5 3 4 (D) 5 none of these
Step by Step Solution
There are 3 Steps involved in it

Get step-by-step solutions from verified subject matter experts