

Question: A quality analyst wants to construct a control chart for determining whether three machines, all producing the same product, are in control with regard to
A quality analyst wants to construct a control chart for determining whether three machines, all producing the same product, are in control with regard to a particular quality variable. Accordingly, she sampled four units of output from each machine, with the following results:
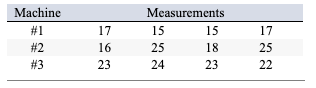
What are the x-bar chart three-sigma upper and lower control limits? Round to 2 decimal places.
UCL = 22, LCL = 18
UCL = 23.29, LCL = 16.71
UCL = 23.16, LCL = 16.84
UCL = 23.5, LCL = 16.5
UCL = 24, LCL = 16
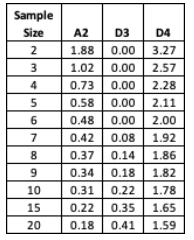
Machine #1 #2 #3 17 16 23 Measurements 15 15 25 18 24 23 17 25 22 D3 Sample Size 2 3 4 5 6 7 8 9 10 15 20 AZ 1.88 1.02 0.73 0.58 0.48 0.42 0.37 0.34 0.31 0.22 0.18 D4 0.00 3.27 0.00 2.57 0.00 2.28 0.002.11 0.00 2.00 0.08 1.92 0.14 1.86 0.18 1.82 0.22 1.78 0.35 1.65 0.41 1.59Step by Step Solution
There are 3 Steps involved in it
1 Expert Approved Answer
Step: 1 Unlock

Question Has Been Solved by an Expert!
Get step-by-step solutions from verified subject matter experts
Step: 2 Unlock
Step: 3 Unlock