

Question: A quality inspector took five samples, each with four observations (n=4), of the length of time for glue to dry. All values are in minutes.
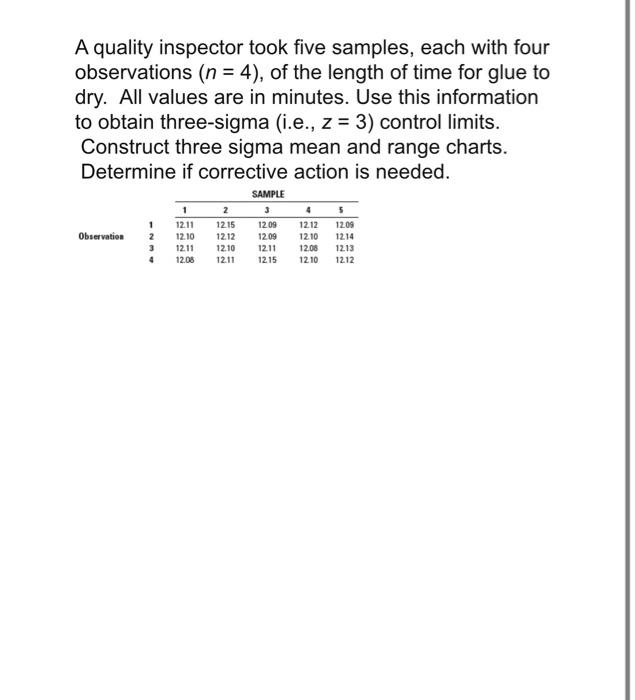
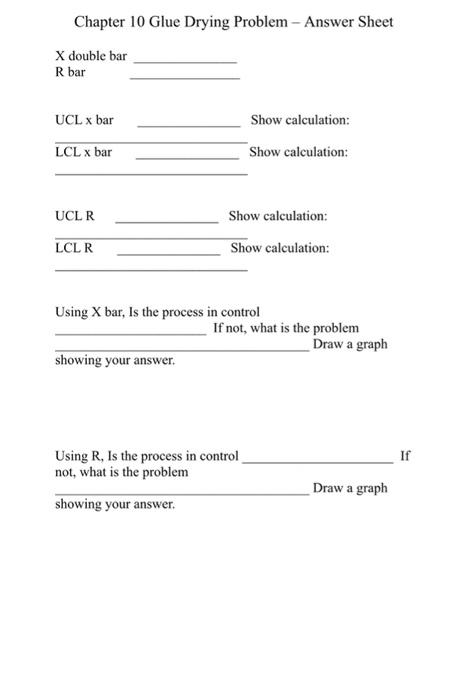
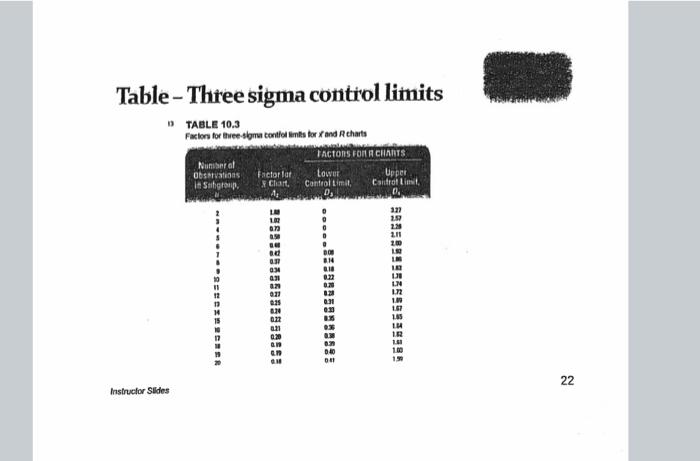
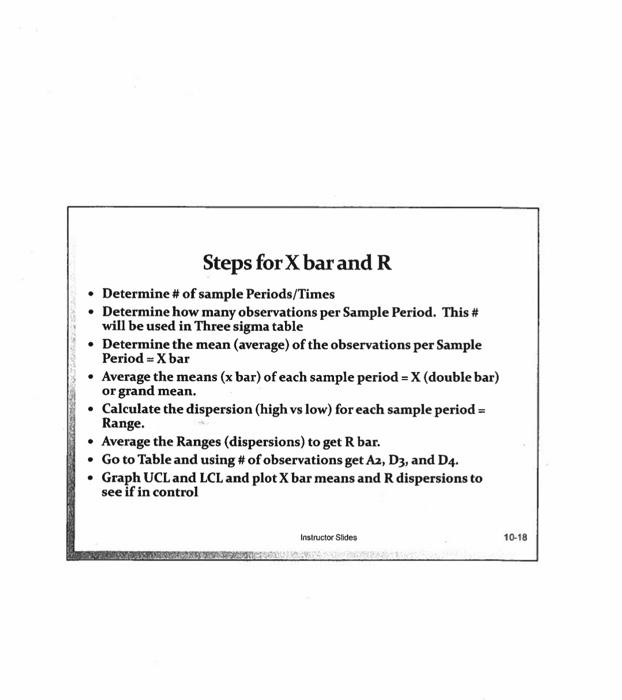
A quality inspector took five samples, each with four observations (n=4), of the length of time for glue to dry. All values are in minutes. Use this information to obtain three-sigma (i.e., z=3 ) control limits. Construct three sigma mean and range charts. Determine if corrective action is needed. Steps for X bar and R - Determine \# of sample Periods/Times - Determine how many observations per Sample Period. This \# will be used in Three sigma table - Determine the mean (average) of the observations per Sample Period = X bar - Average the means ( x bar) of each sample period = X (double bar) or grand mean. - Calculate the dispersion (high vs low) for each sample period = Range. - Average the Ranges (dispersions) to get R bar. - Go to Table and using \# of observations get A2,D3, and D4. - Graph UCL and LCL and plot X bar means and R dispersions to see if in control Instructor Silides 1018 Using X bar, Is the process in control If not, what is the problem Draw a graph showing your answer. Using R, Is the process in control If not, what is the problem showing your answer. Draw a graph Table - Three sigma contiol limits b TABLE 10.3
Step by Step Solution
There are 3 Steps involved in it

Get step-by-step solutions from verified subject matter experts