

Question: A reduced model for viscosity was developed in Minitab Comment on this model. What further action might you take based on the residuals? fPart 2
- A reduced model for viscosity was developed in Minitab
- Comment on this model. What further action might you take based on the residuals?
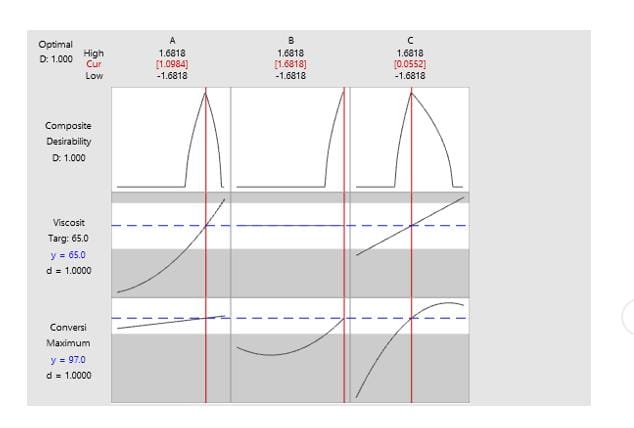
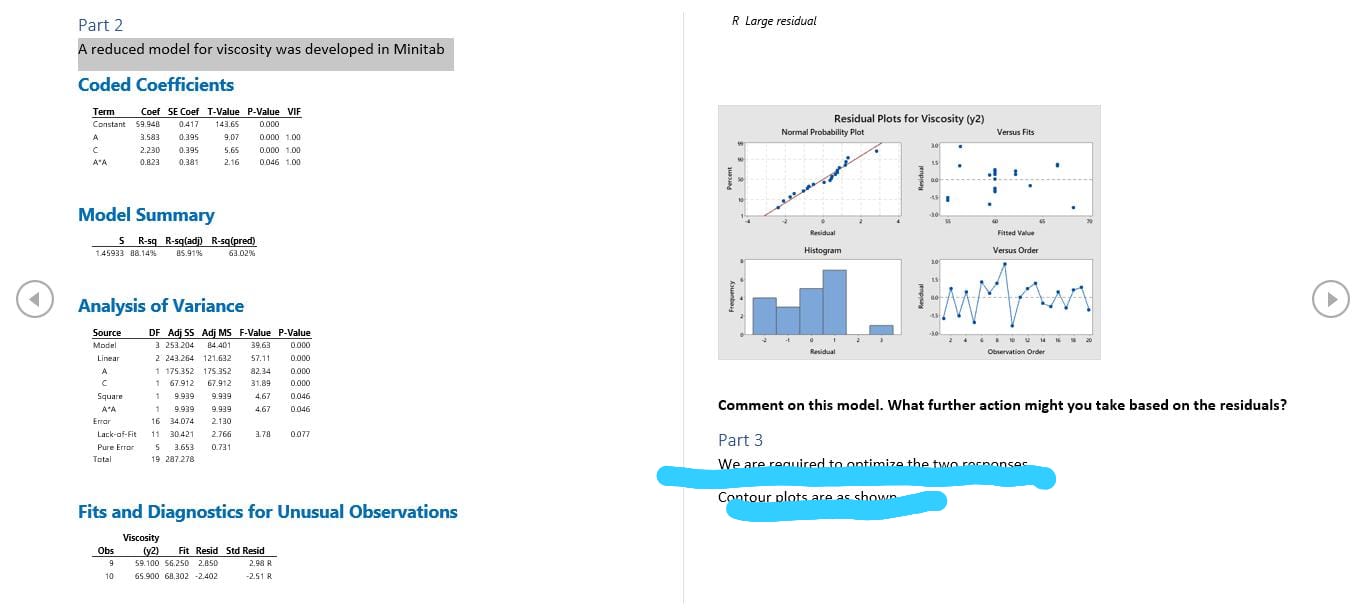
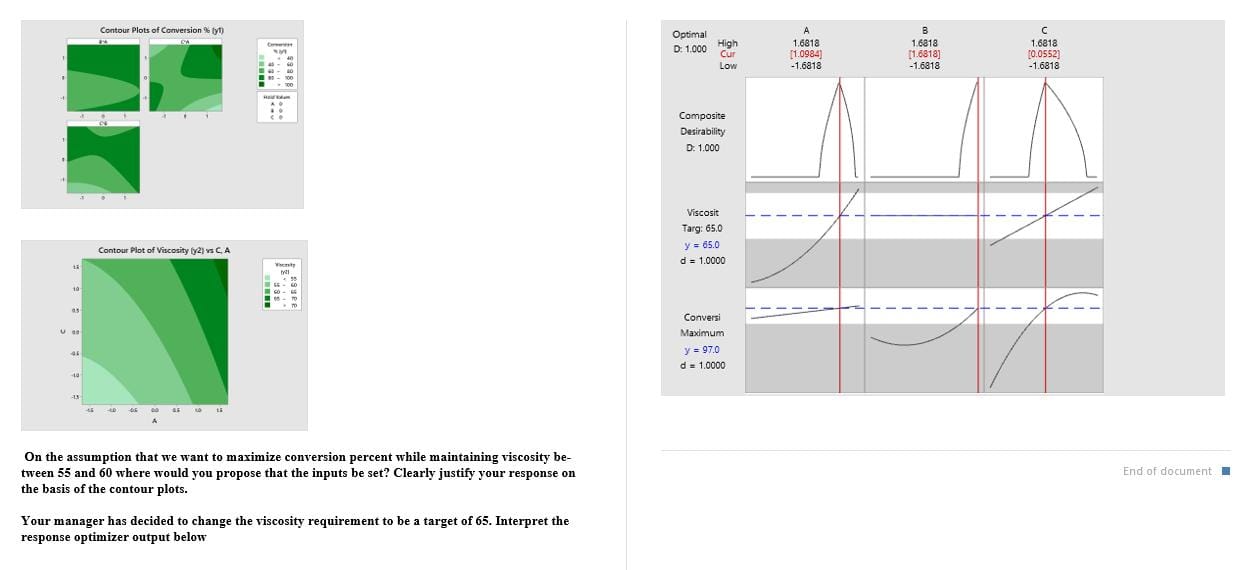
\fPart 2 R Large residual A reduced model for viscosity was developed in Minitab Coded Coefficients Term Coef SE Coef T-Value P-Value VIF Residual Plots for Viscosity (y2) Constant 59.940 0.417 143.65 DOOC Normal Probability Plot Versus Fits 3.583 0.395 9.07 0:000 1.00 2.230 0.395 5.65 DOGO 1.00 0.823 0.381 2.16 0:046 1.00 Percent Model Summary Residual Fitsed Value 5 R-sq R-sqladj) R-sq(pred) 1.45933 08.14%% 63.0276 Histogram Versus Order 85.91%% Frequency Analysis of Variance AM O Source OF Adj 55 Adj MS F-Value P-Value Model 3 253 204 84 401 39.63 0.000 Residual Otnervation Order Linear 2 243 264 121.632 57.11 DO00 1 175.352 175 352 82.34 1 67.912 67.912 31.89 0.000 Square 9.939 9 939 0.046 A'A 9 939 9 939 1 67 0 04 Comment on this model. What further action might you take based on the residuals? Era 16 34.074 2.130 Lack-of-Fit 11 30421 2 760 BLE 0077 Part 3 Pure Error 5 3.653 0.731 Total 19 287.278 We are required to optimize the two cornonser Contour plots are ac showm Fits and Diagnostics for Unusual Observations Viscosity Obs (2) Fit Resid Std Resid 9 59.100 56.250 2.850 2,98 R 10 65.900 68 302 -2.402 -251 RContour Plots of Conversion %% ty!) Optimal A B C D: 1.000 High 1.6818 1.6818 1.6818 Cur [1.0984) [1.6818] (0.0552] Low -1.6818 -1.6818 -1.6818 Composite Desirability D: 1.000 Viscosit Targ: 65.0 Contour Plot of Viscosity (y2] is C, A y = 65.0 d = 1.0000 Conversi Maximum y = 97.0 d = 1.0000 On the assumption that we want to maximize conversion percent while maintaining viscosity be- tween 55 and 60 where would you propose that the inputs be set? Clearly justify your response on End of document the basis of the contour plots. Your manager has decided to change the viscosity requirement to be a target of 65. Interpret the response optimizer output below
Step by Step Solution
There are 3 Steps involved in it

Get step-by-step solutions from verified subject matter experts