

Question: A scoring function reported scores for 10 positive data points and 10 negative ones as follows: No. 1 WN Score 25 21 20 19 18
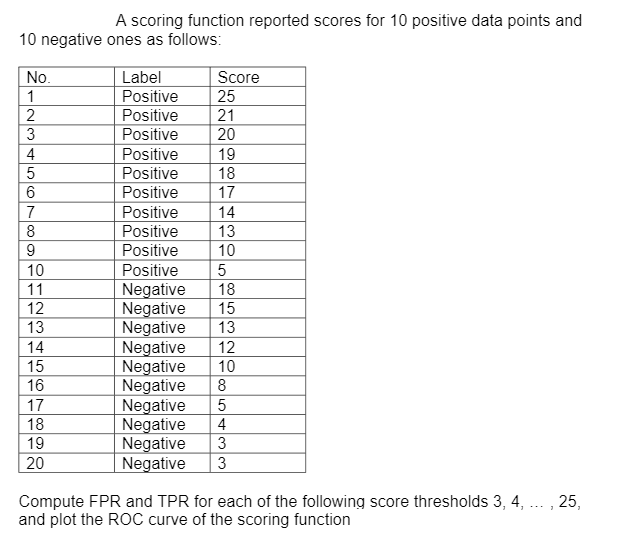
A scoring function reported scores for 10 positive data points and 10 negative ones as follows: No. 1 WN Score 25 21 20 19 18 17 4 5 6 7 8 9 10 11 12 13 14 15 16 17 18 19 20 Label Positive Positive Positive Positive Positive Positive Positive Positive Positive Positive Negative Negative Negative Negative Negative Negative Negative Negative Negative Negative 14 13 10 5 18 15 13 12 10 8 5 4 3 3 Compute FPR and TPR for each of the following score thresholds 3, 4, ... , 25, and plot the ROC curve of the scoring function A scoring function reported scores for 10 positive data points and 10 negative ones as follows: No. 1 WN Score 25 21 20 19 18 17 4 5 6 7 8 9 10 11 12 13 14 15 16 17 18 19 20 Label Positive Positive Positive Positive Positive Positive Positive Positive Positive Positive Negative Negative Negative Negative Negative Negative Negative Negative Negative Negative 14 13 10 5 18 15 13 12 10 8 5 4 3 3 Compute FPR and TPR for each of the following score thresholds 3, 4, ... , 25, and plot the ROC curve of the scoring function
Step by Step Solution
There are 3 Steps involved in it

Get step-by-step solutions from verified subject matter experts