

Question: {a) Setup the simulation environment as shown in Fig. 3. Explain the direction of the field on the surface of the sphere. (b) Calculate the
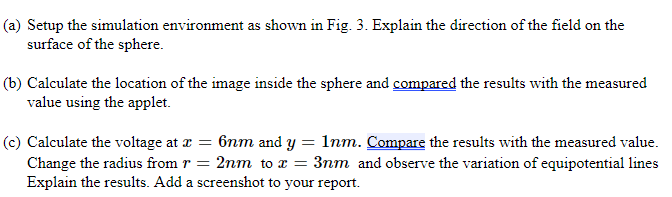
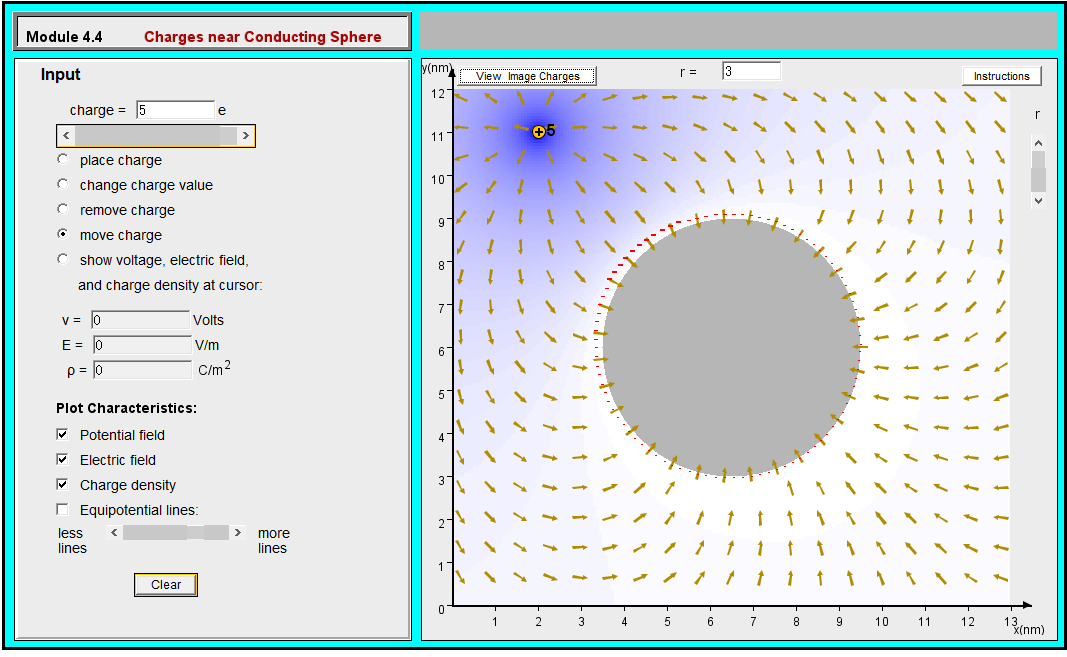
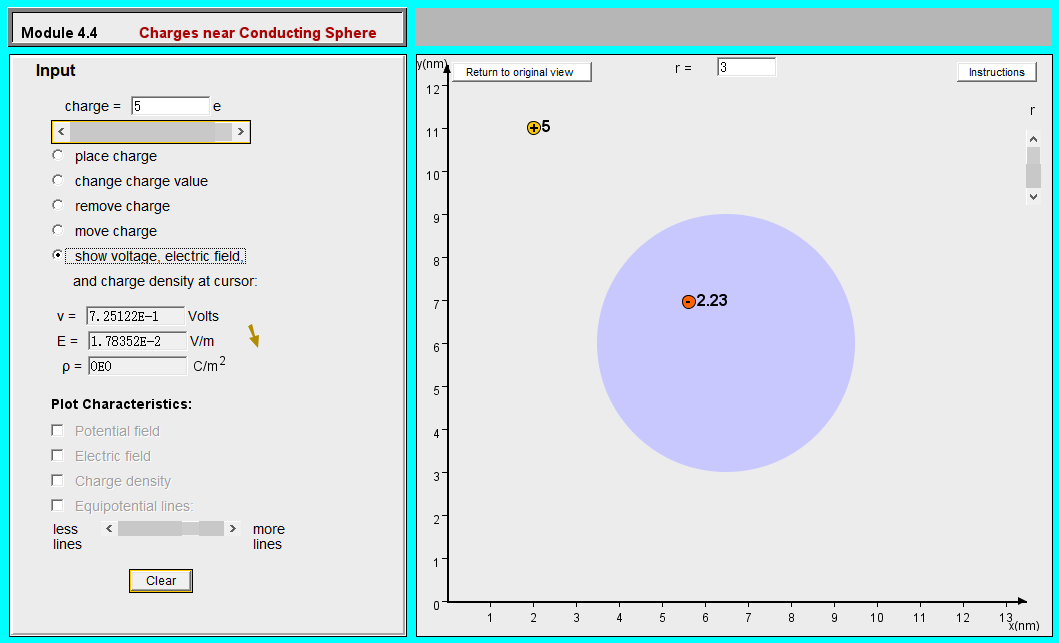
{a) Setup the simulation environment as shown in Fig. 3. Explain the direction of the field on the surface of the sphere. (b) Calculate the location of the image inside the sphere and compared the results with the measured value using the applet. {c) Calculate the voltage at # = 6nm and y = 1nm. Compare the results with the measured value. Change the radius from = 2nm to & = 3nm and observe the variation of equipotential lines Explain the results. Add a screenshot to vour report. Module 4.4 Charges near Conducting Sphere Input y(nm) View Image Charges r= 3 Instructions 127 charge = 5 e 11 7 place charge change charge value 10 remove charge [ move charge C show voltage, electric field, 8 and charge density at cursor: 711 V = Volts E = 0 V/m 6- p = 0 C/m2 5 - Plot Characteristics: Potential field Electric field Charge density 3- I Equipotential lines: 2 less more lines lines Clear W 4 5 6 7 8 9 10 11 12 13{nm)
Step by Step Solution
There are 3 Steps involved in it

Get step-by-step solutions from verified subject matter experts