

Question: A. Statistics for stocks A and B are shown in the following table. Stocks Expected return A B Correlation (A, B) = 0.28 11.2%
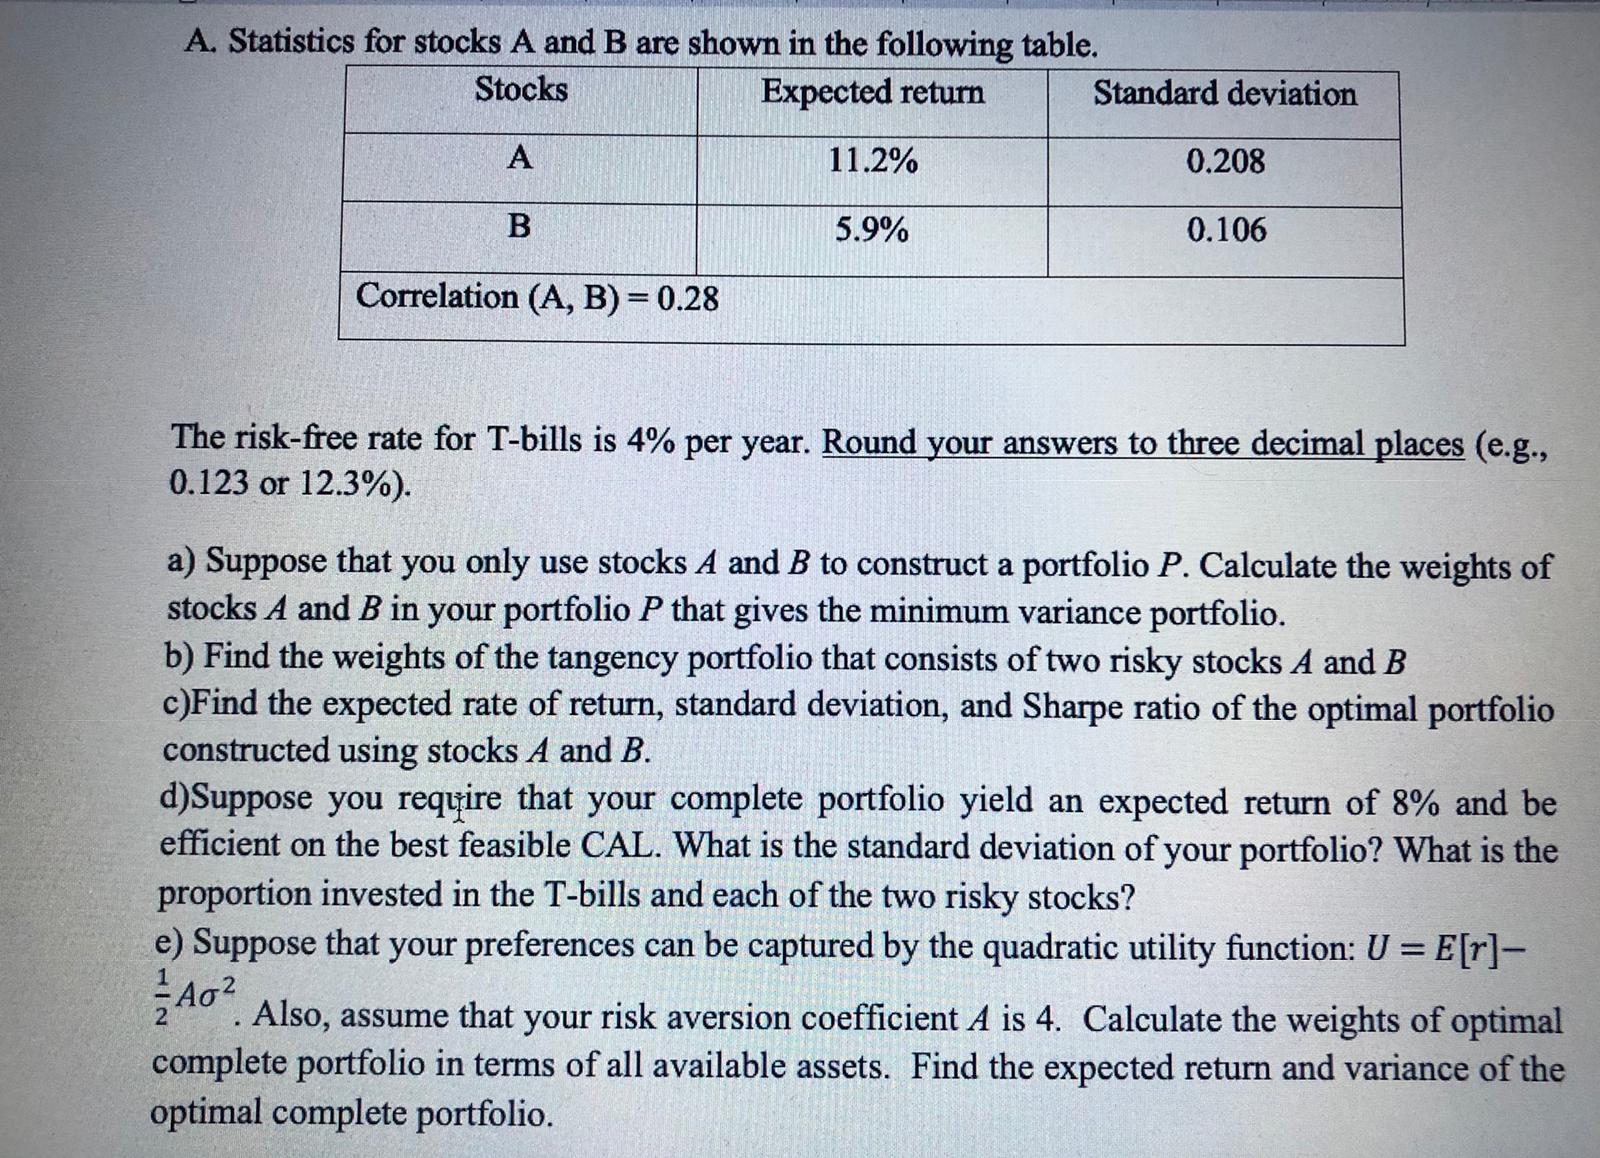
A. Statistics for stocks A and B are shown in the following table. Stocks Expected return A B Correlation (A, B) = 0.28 11.2% 5.9% Standard deviation 0.208 0.106 The risk-free rate for T-bills is 4% per year. Round your answers to three decimal places (e.g., 0.123 or 12.3%). a) Suppose that you only use stocks A and B to construct a portfolio P. Calculate the weights of stocks A and B in your portfolio P that gives the minimum variance portfolio. b) Find the weights of the tangency portfolio that consists of two risky stocks A and B c)Find the expected rate of return, standard deviation, and Sharpe ratio of the optimal portfolio constructed using stocks A and B. d) Suppose you require that your complete portfolio yield an expected return of 8% and be efficient on the best feasible CAL. What is the standard deviation of your portfolio? What is the proportion invested in the T-bills and each of the two risky stocks? e) Suppose that your preferences can be captured by the quadratic utility function: U = E[r]- A Also, assume that your risk aversion coefficient A is 4. Calculate the weights of optimal complete portfolio in terms of all available assets. Find the expected return and variance of the optimal complete portfolio.
Step by Step Solution
There are 3 Steps involved in it
To calculate the weights of stocks A and B in the portfolio and other related quantities we can use the principles of portfolio theory and the Capital Asset Pricing Model CAPM Here are the calculation... View full answer

Get step-by-step solutions from verified subject matter experts