

Question: A study compared three display panels used by air trafc controllers. Each display panel was tested for four different simulated emergency conditions. Twenty-four highly trained
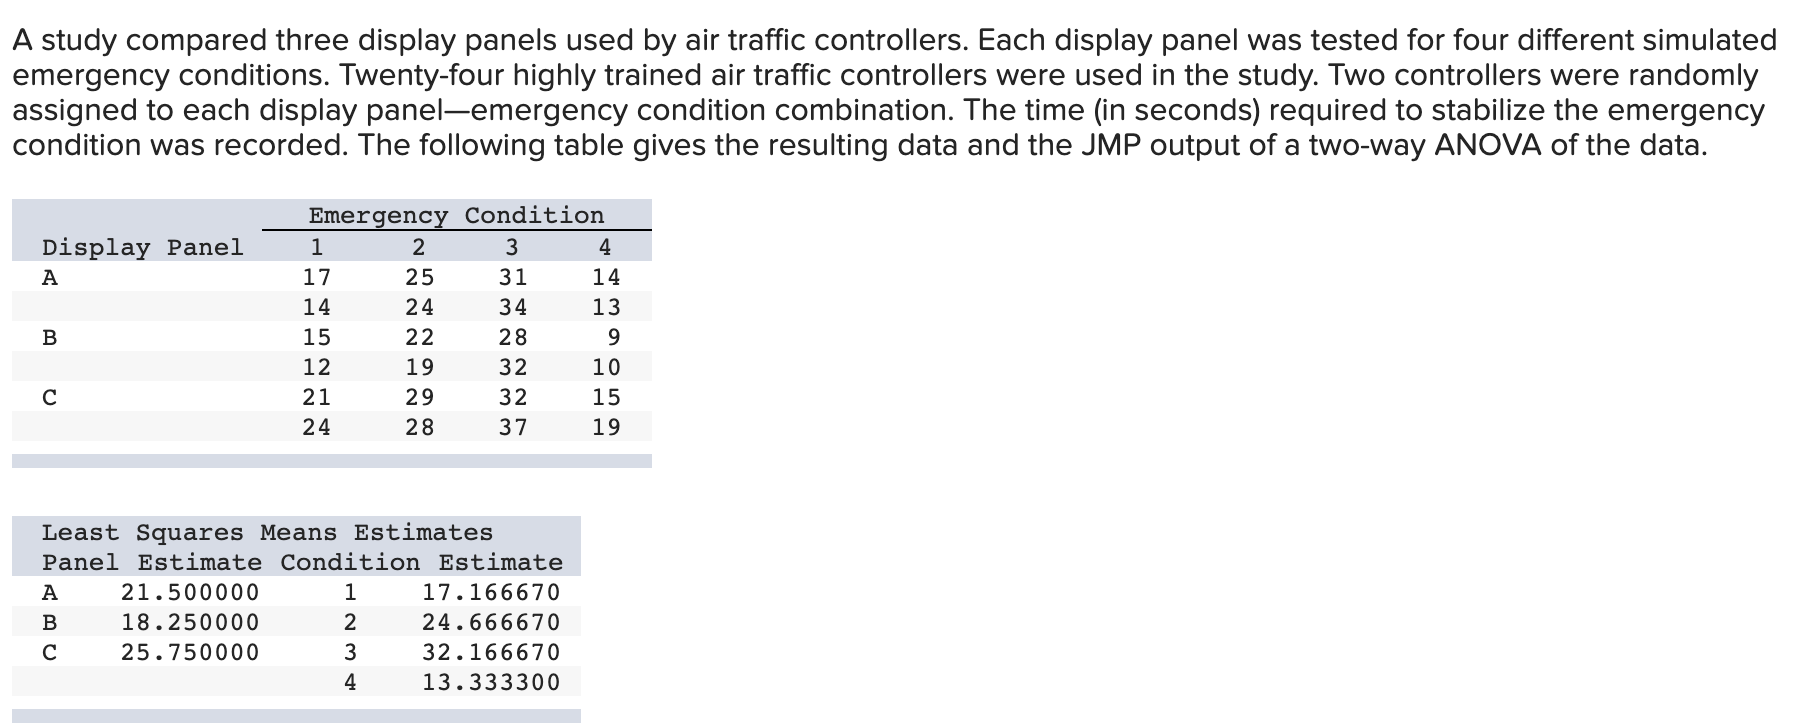
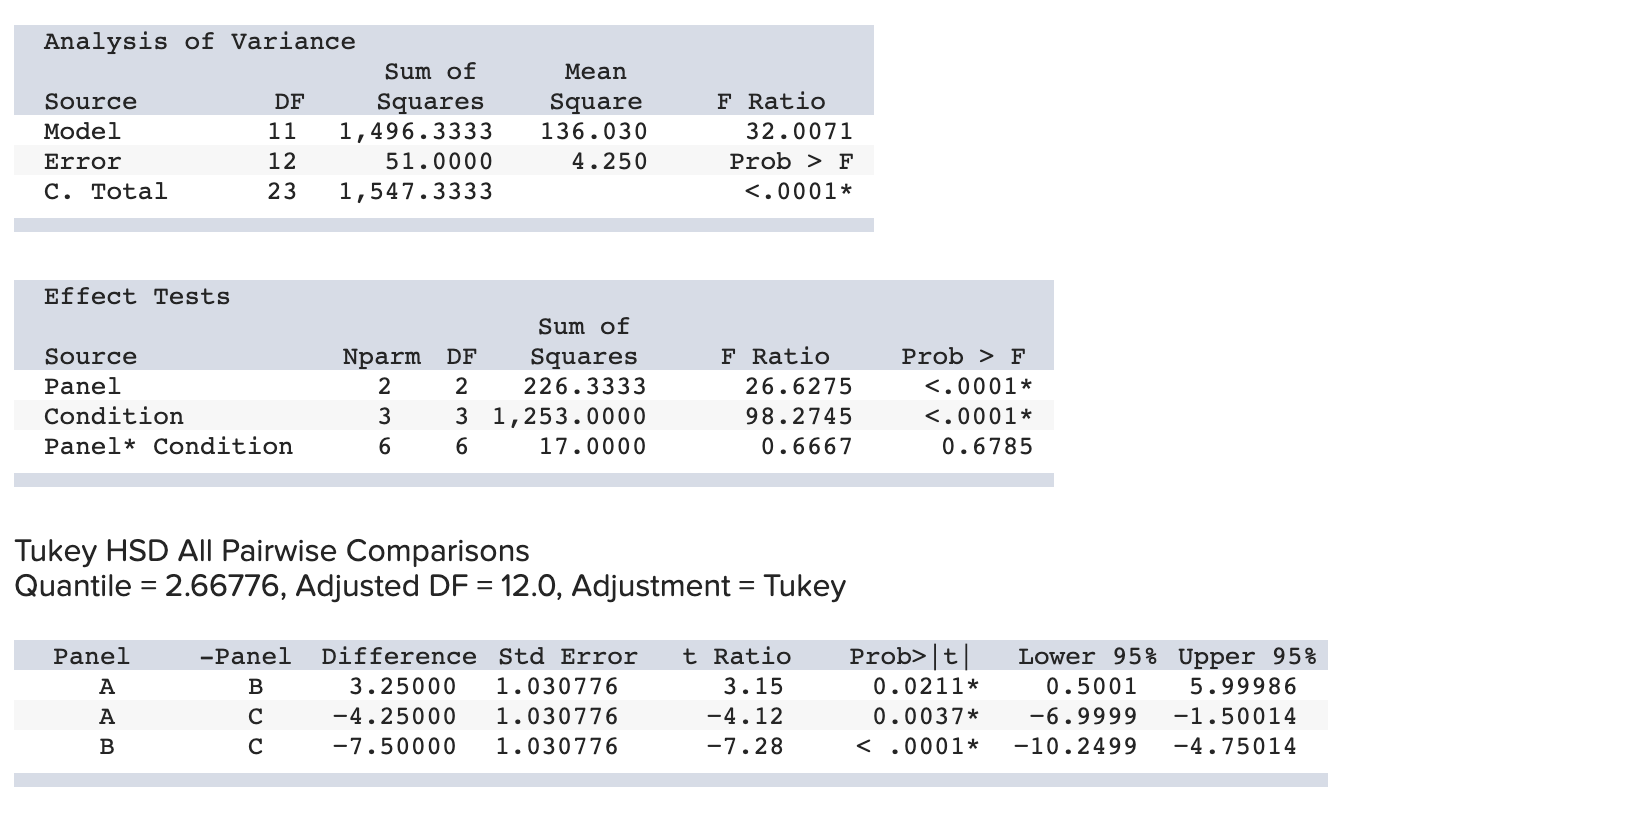
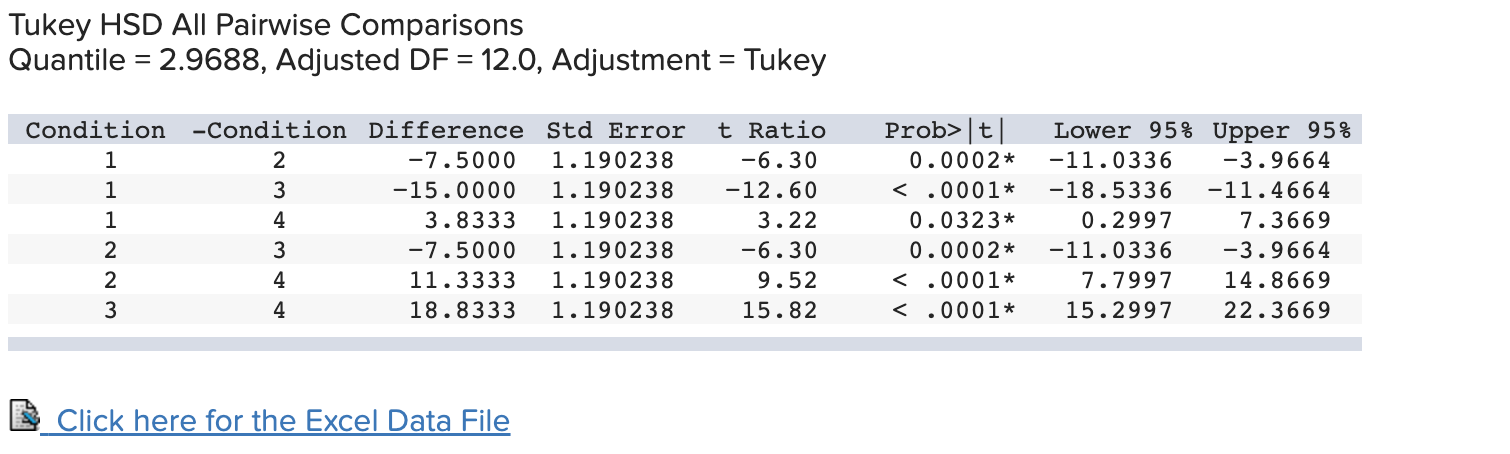

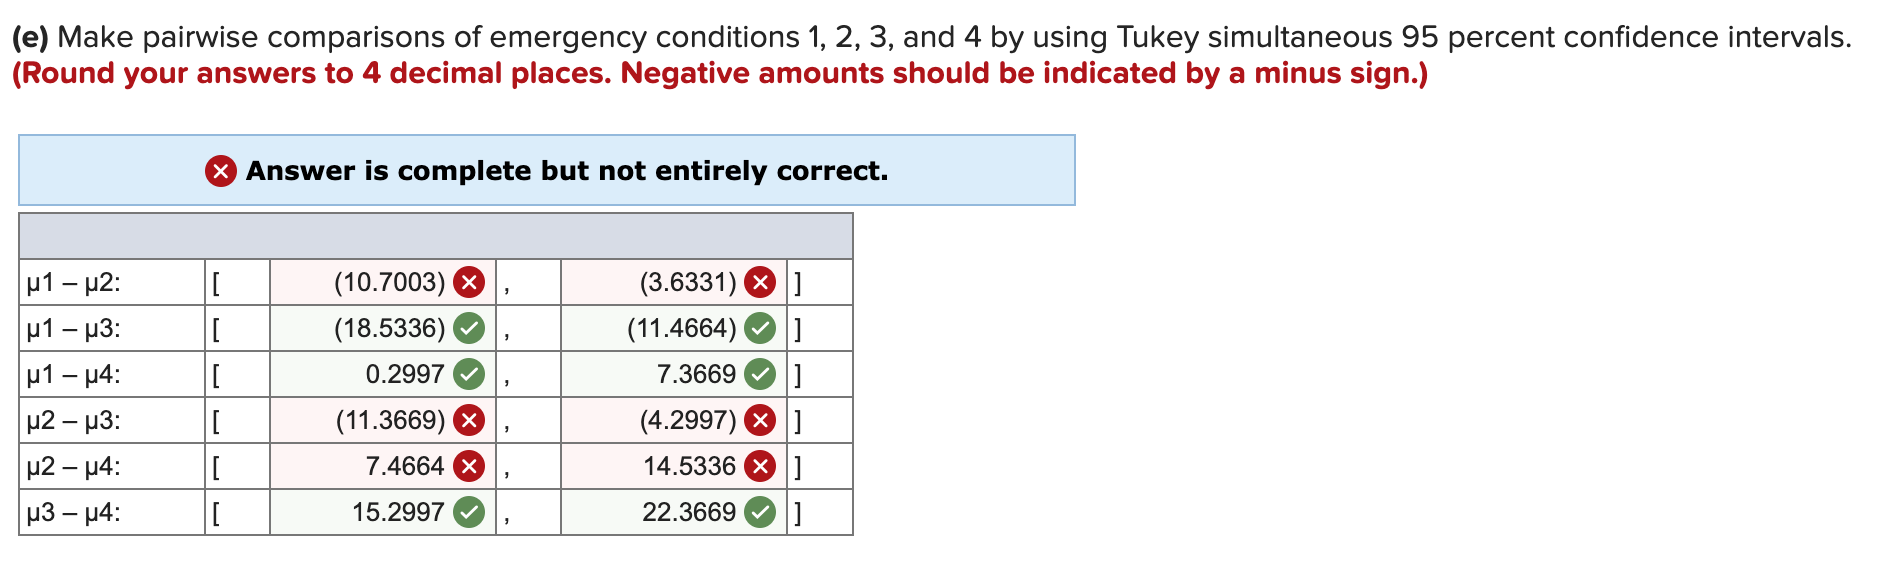


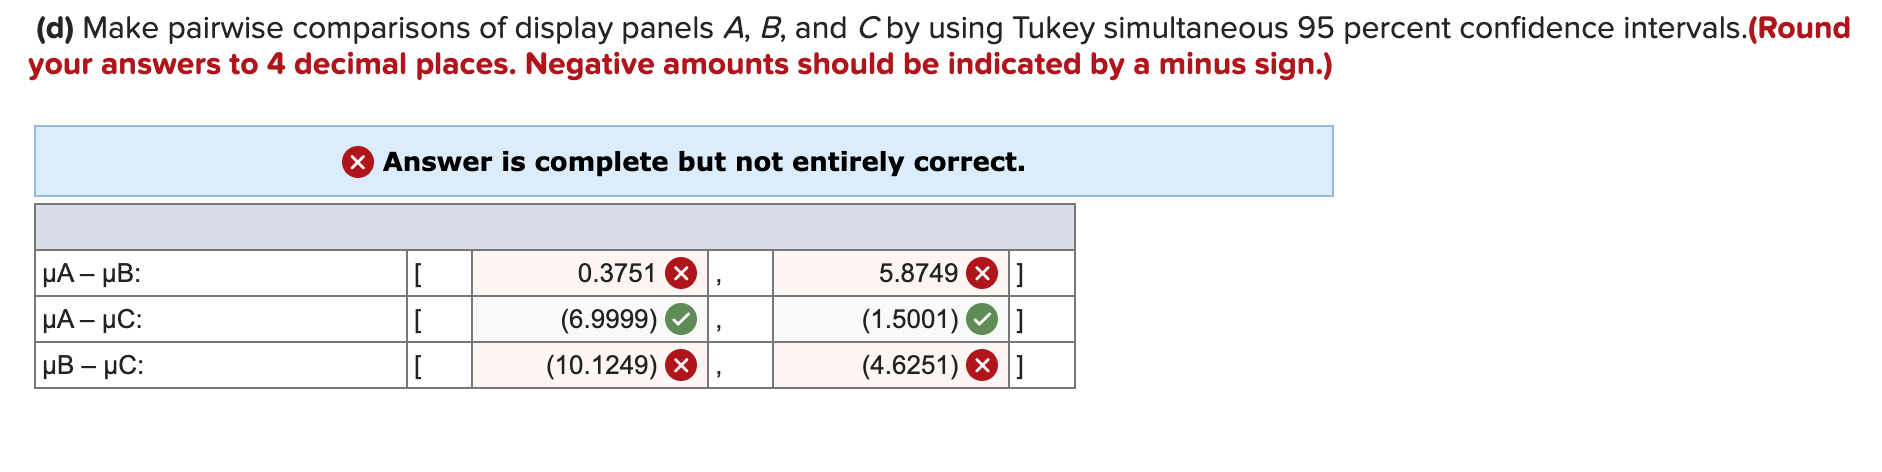

A study compared three display panels used by air trafc controllers. Each display panel was tested for four different simulated emergency conditions. Twenty-four highly trained air trafc controllers were used in the study. Two controllers were randomly assigned to each display panelemergency condition combination. The time (in seconds) required to stabilize the emergency condition was recorded. The following table gives the resulting data and the JMP output of a two-way ANOVA of the data. Emergency Condition Display Panel 1 2 3 4 A 17 25 31 14 14 24 34 13 B 15 22 28 9 12 19 32 10 C 21 29 32 15 24 28 37 19 Least Squares Means Estimates Panel Estimate Condition Estimate A 21.500000 1 17.166670 B 18.250000 2 24.666670 C 25.750000 3 32.166670 4 13.333300 Analysis of Variance Sum of Mean Source DF Squares Square F Ratio Model 11 1, 496.3333 136 . 030 32 . 0071 Error 12 51 . 0000 4. 250 Prob > F C. Total 23 1, 547.3333 <. effect tests sum of source nparm i squares f ratio prob> F Panel 2 2 226.3333 26. 6275 <. condition . panel tukey hsd all pairwise comparisons quantile="2.66776," adjusted df="12.0," adjustment="Tukey" difference std error t ratio prob> | t/ Lower 95% Upper 95% A B 3 . 25000 1 . 030776 3 . 15 0 . 0211* 0 . 5001 5. 99986 A C -4. 25000 1 . 030776 -4. 12 0 . 0037* -6. 9999 -1 . 50014 B C -7. 50000 1 . 030776 -7.28 | t Lower 95% Upper 95% -7. 5000 1 . 190238 -6.30 0 . 0002* -11 . 0336 -3 . 9664 -15 . 0000 1 . 190238 -12 . 60
Step by Step Solution
There are 3 Steps involved in it

Get step-by-step solutions from verified subject matter experts