

Question: a) Table 2 shows the activities in the project for device production facility. Answer the following questions. Table 2 Activity Immediate Predecessor Normal Duration Cost
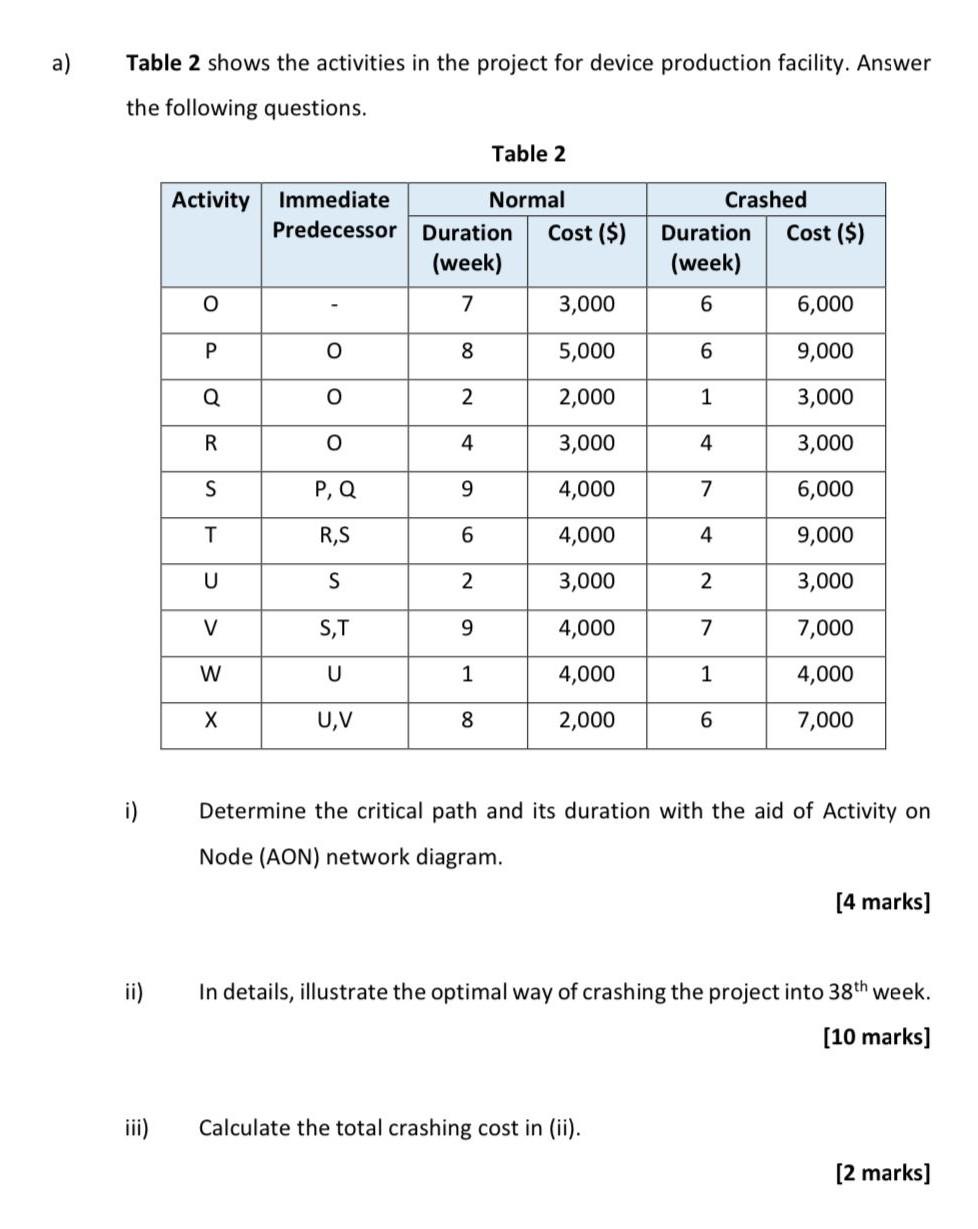
a) Table 2 shows the activities in the project for device production facility. Answer the following questions. Table 2 Activity Immediate Predecessor Normal Duration Cost ($) (week) 7 3,000 Crashed Duration Cost ($) (week) 6 6,000 O P O 8 5,000 6 9,000 Q O 2 2,000 1 3,000 R o 4 3,000 4 3,000 S P, Q 9 4,000 7 6,000 T RS 6 4,000 4 9,000 U S 2 3,000 2 3,000 V ST 9 4,000 7 7,000 W U 1 4,000 1 4,000 X UV 8 2,000 6 7,000 i) Determine the critical path and its duration with the aid of Activity on Node (AON) network diagram. (4 marks] ii) In details, illustrate the optimal way of crashing the project into 38th week. [10 marks] iii) Calculate the total crashing cost in (ii). [2 marks]
Step by Step Solution
There are 3 Steps involved in it
1 Expert Approved Answer
Step: 1 Unlock

Question Has Been Solved by an Expert!
Get step-by-step solutions from verified subject matter experts
Step: 2 Unlock
Step: 3 Unlock