

Question: A US based client holds a welldiversified equity portfolio which has lost considerable money recently due to COVID19 and the subsequent economic slowdown. The portfolio
A US based client holds a welldiversified equity portfolio which has lost considerable money recently due to COVID19 and the subsequent economic slowdown. The portfolio is currently worth $110 million and has a beta of 1.40. Moreover, the expected dividend yield on the equity portfolio is 2.40% per annum with simple compounding. The client is concerned about a further downturn in the market (as she is not sure if the markets have quite reached the bottom). She has therefore requested your advice on how best to protect the (remaining) value of her portfolio. Yet she is still keen to benefit if the market moves favourably. The S&P500 index is currently at 2,823 and the dividend yield of the S&P500 index is 2.13% per annum with simple compounding. The riskfree interest rate is 0.15% per annum with continuous compounding for all maturities.
(a) Describe the options portfolio insurance strategy that would insure against your clients portfolio falling below $100 million over the next four months. Available index options are quoted in increments of five index points. Explain why this strategy fulfils the clients request and why hedging with index futures does not suffice.
(b) Calculate the gains/losses on the strategy if the level of the S&P500 index in four months is either (i) 2,000, or (ii) 3,000, and prepare a short summary for your client to discuss the outcome of the insurance strategy in these two scenarios. (Note you do not need to calculate the insurance premium).
Your client is impressed by the proposed strategy, but she is surprised by how expensive the insurance premium is. You state that this is due to an increased market volatility brought about by the uncertainty over the future impact of COVID19. To explain things further you decide to investigate the implied volatility of the S&P500 index using market option prices.
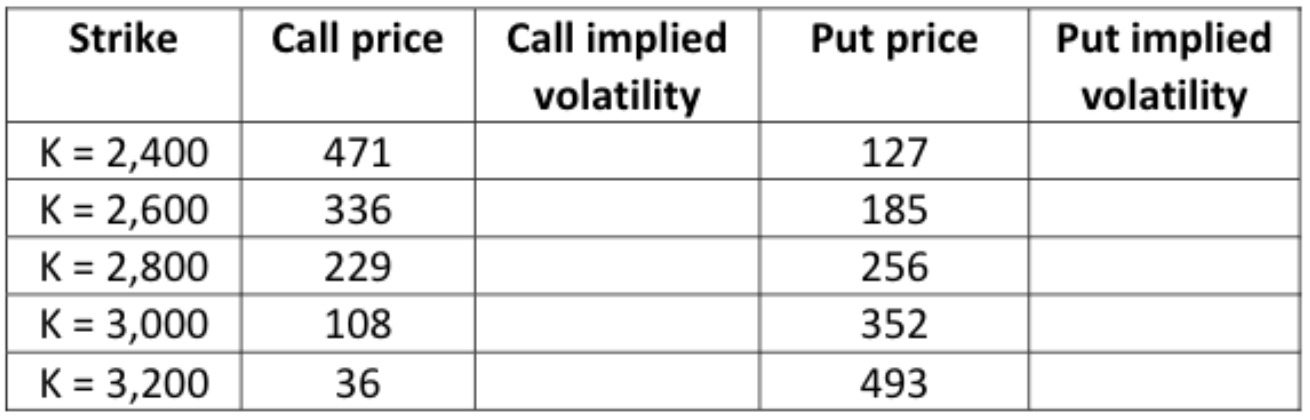
(c) Use Excels GoalSeek (or otherwise) to estimate the implied volatility of the index, based on market prices of fourmonth European call and put options on the index. Specifically, complete the following table with the estimated implied volatilities (to 3 significant figures). Note you will need information stated earlier in the question to do this:
 You should also answer the following questions:
i. Plot the implied volatility as a function of the strike price.
ii. Are the option prices consistent with the assumptions underlying the BlackScholes model? Does the implied volatility depend on the moneyness of the option? Explain.
iii. Explain how implied volatility differs from the historical volatility.
Strike Call price Put price Call implied volatility Put implied volatility K = 2,400 K = 2,600 K = 2,800 K = 3,000 K = 3,200 471 336 229 108 127 185 256 352 493 36 Strike Call price Put price Call implied volatility Put implied volatility K = 2,400 K = 2,600 K = 2,800 K = 3,000 K = 3,200 471 336 229 108 127 185 256 352 493 36
Step by Step Solution
There are 3 Steps involved in it

Get step-by-step solutions from verified subject matter experts