Question: a. Use the data given to calculate annual returns for Grcsman, Landow, and the Market Index, and then calculate average returns over the five-year period.
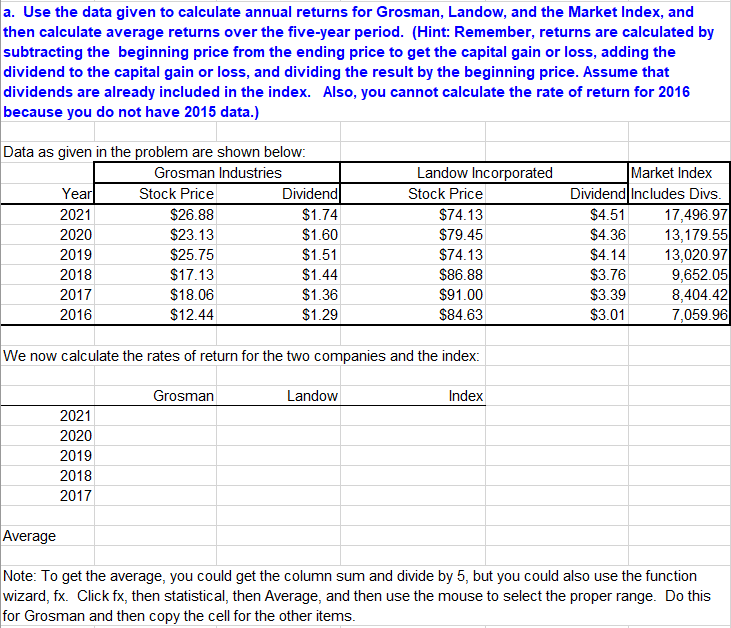
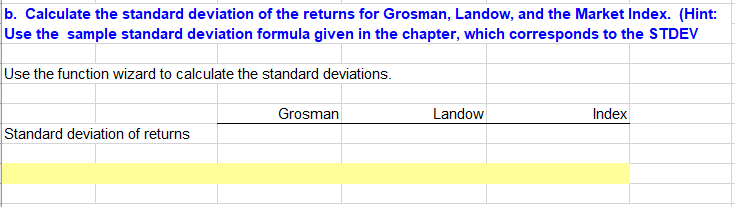
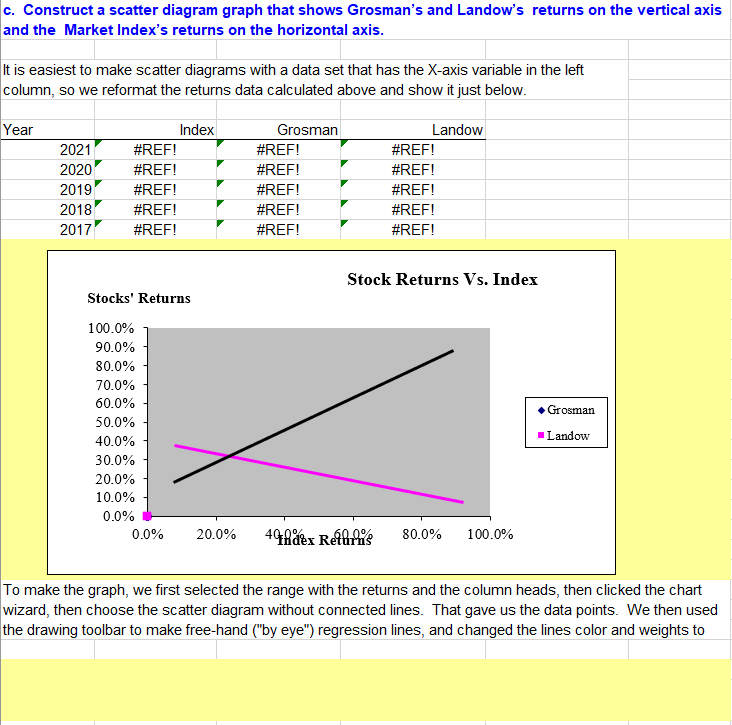
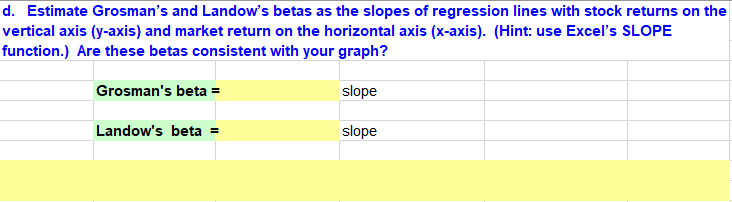
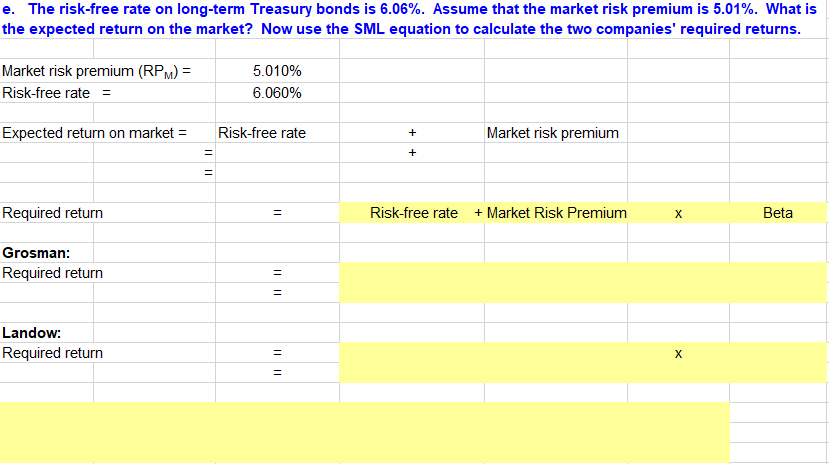
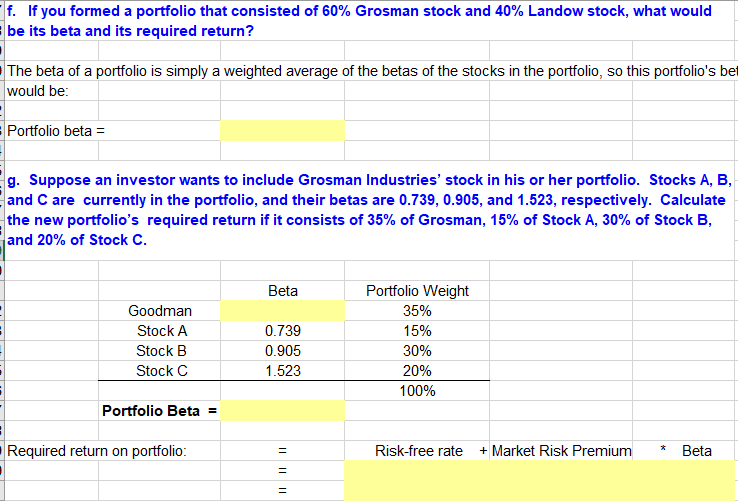
a. Use the data given to calculate annual returns for Grcsman, Landow, and the Market Index, and then calculate average returns over the five-year period. (Hint: Remember, returns are calculated by subtracting the beginning price from the ending price to get the capital gain or loss, adding the dividend to the capital gain or loss, and dividing the result by the beginning price. Assume that dividends are alreadyr included in the index. Also, you cannot calculate the rate of return for 2313 because you do not have 2315 data.] Includes Die- 2321 $23.33 $1.24 $?4.13 $4.51 1i\".4313.3ir 2323 $23.13 $1.33 $?3.45 $4.33 13123.55 2313 $25.25 $1.51 $?4.13 $4.14 13.323.3ir 2313 $1?.13 $1.44 $33.33 $3.23 3352.35 231? $3.33 343442 $3.31 235333 Data as given in the problem are shown below: We now calculate the rates of return for the two companies and the index: lSrosman Landow Index 2321 2323 2313 2313 231? verage Note: To get the average; you could get the column sum and divide by 5; but you could also use the function wizard: fx. |Sliplt ix; then statistical; then leverage: and then use the mouse to select the proper range. Do this for |Srosman and then copy the cell for the other items. b. Calculate the standard deviation of the returns for Grosman, Landow, and the Market Index. (Hint: Use the sample standard deviation formula given in the chapter, which corresponds to the STIZIIEluIr Use the function wizard to calculate the standard deviations. Grosman LandovI.r Index Standard deviation of returns o. Construct a scatter diagram graph that shows Grosman's and Landow's returns on the vertical axis and the Market lndex's returns on the horizontal axis. It is easiest to make scatter diagrams with a data set that has the Kaxis 1.rariable in the left column= so we reformat the returns data calculated above and show itjost below. 'r'ear Index lGrosman Landow 2o21' #REF! " #FtEF! ' #REF! eoeo' #REF! " #REF! ' #REF! 2o1s' #REF! " #FtEF! ' #REF! 2m 8" #REF! " #REF! ' #REF! F F 201 1'" #REF! #REF! #REF! Stock Returns Vs. Index Stocks' Returns 100 0% 90.0% 30.0% T0.0% 50.0% 50.0% 40.0% 3 0.0% 20.0% 10.0% 0.0% 0.0% 20.0% 4%9001 Reif 00.0% 100.0% To make the graph; we first selected the range with the returns and the column heads; then clicked the chart wizard. then choose the scatter diagram without connected lines. That gave us the data points. We then used the drawing toolbar to make freehand ("byr eye\") regression lines; and changed the lines color and weights to \fe. The risk-free rate on long-term Treasury bonds is 6.06%. Assume that the market risk premium is 5.01%. What is the expected return on the market? Now use the SML equation to calculate the two companies' required returns. Market risk premium (RPM) = 5.010% Risk-free rate = 6.060% Expected return on market = Risk-free rate + Market risk premium + = Required return Risk-free rate + Market Risk Premium X Beta Grosman: Required return = = Landow: Required return = X' f. If you formed a portfolio that consisted of 55% Grosman stock and 45% Landow stoolt, what would : be its beta and its required return? I l The beta of a portfolio is simply,r a weighted average of the betas of the stocks in the portfolio, so this portfolio's be1 would be: : Portfolio beta = I 9. Suppose an investor wants to include Grosman lndustries' stool: in his or her portfolio. Stoolts A, B, i and C are currently in the portfolio, and their betas are 5.?35, 5.955, and 1.523, respectively. Caloulate . the new portfolio's required return if it consists of 35% of Grosman, 15% of Stock A, 35% of Stock E, i and ans, of Stool: o. l Beta Portfolio Weight ! Goodman 35% : Stock r 5.?35 15% - Stock: 5 5.555 35% i Stock C 1.523 25% i 1 55% ' Portfolio Beta = | Required return on portfolio: l Riskfree rate +fularl
Step by Step Solution
There are 3 Steps involved in it
1 Expert Approved Answer
Step: 1 Unlock
Question Has Been Solved by an Expert!
Get step-by-step solutions from verified subject matter experts
Step: 2 Unlock
Step: 3 Unlock
Students Have Also Explored These Related Accounting Questions!