Question: Assignment Description For this particular assignment, refer to the example provided as well as the information below! Make sure you use the rubric to ensure
Assignment Description
For this particular assignment, refer to the example provided as well as the information below! Make sure you use the rubric to ensure you include all of the necessary components/requirements.
For the purpose of this exercise, use the company you chose (in the Checkpoint Assignment Company Selection assignment) to conduct an environmental scan (SWOT analysis) and a financial analysis. The analysis of you company should culminate with you recommending that the company is "excellent," "healthy," or "ill." You will be evaluated based on correctness of the calculations, the insight of the analysis, and the quality of the discussion relating to the requirements.
Before performing the financial analysis, remember to prepare an environmental scan (or SWOT analysis), which discusses the various forces with which the organization must contend to assure that its business model has a chance for success (strengths, weaknesses,,opportunities and threats).
Assignment Requirement
The specific calculations should include:
DuPont Identity
Current Ratio
Quick Ratio
Inventory Holding Period
Average Collection Period
Debt Ratio
Dividend Yield
Required Rate of Return based on the Capital Asset Pricing Model
Free Cash Flow
Market Value Added
Economic Value Added
Along with the spreadsheets, you are expected to prepare an executive summary highlighting your findings along with any relevant information on the process of capital budgeting, using an example that is specific to the company that is being analyzed. The executive summary should also cover the cost-volume-profit analysis, using an example that is specific to the company that is being analyzed.
The written paper is to be submitted in APA format .Links to an external site.
View Rubric
COMPANY OF CHOICE
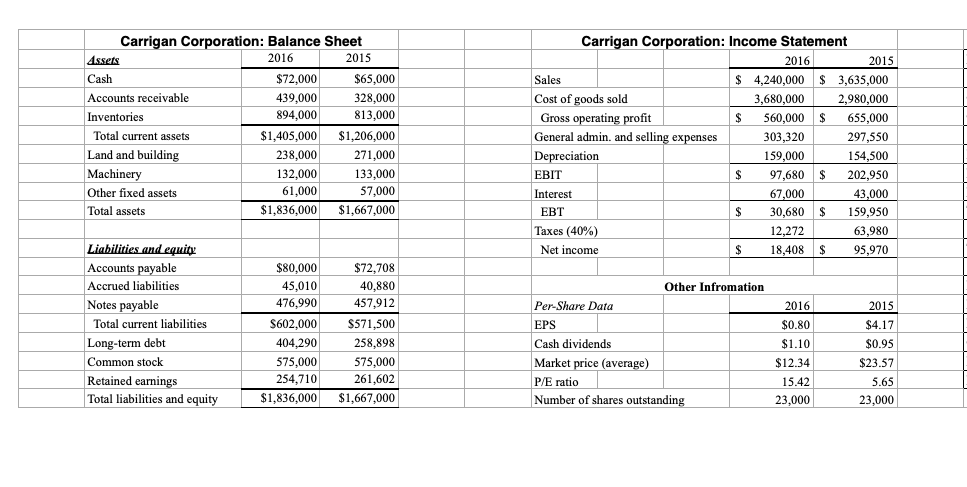
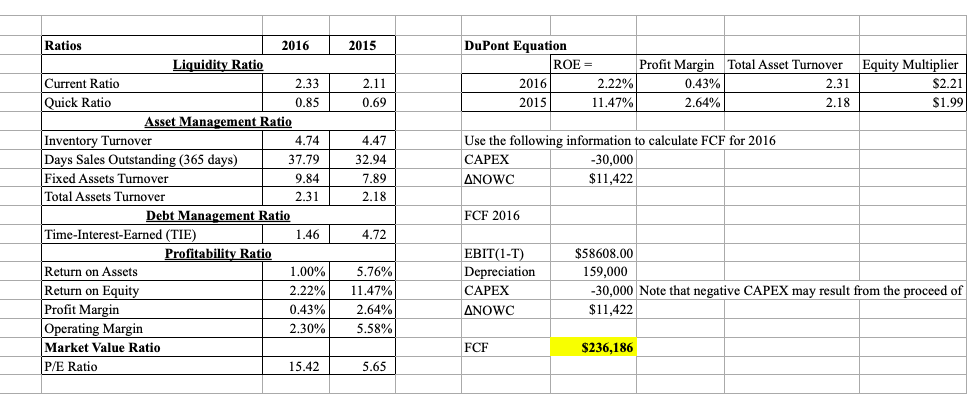
Company Choice for Approval: Tesla, Inc. I am choosing Tesla, Inc. for my financial analysis project. Tesla is a leading company in the electric vehicle and sustainable energy industries, making it a relevant and interesting subject for an in-depth financial analysis. Its innovative approach, significant global presence, and rapid growth offer a rich opportunity for analyzing various financial metrics and understanding how the company navigates a competitive and evolving market. ration: Balance Sheet 2016 20]5 Accounts receivable Carrigan Corporation: Income Statement 2016 2015, | $72,000 sss 000 Sales $ 4240000 | 3635000 | | Inventories Total current assets 439,000 328,000 894,000 813,000 Cost of goods sold 3,680,000 2,980,000 Gross operating profit 560000 [ 655,000 Land and building Machinery $1,405,000) $1,206,000 238,000 271,000 303,320 297,550 epreciation 159,000 154,500 97,680 [$ 202,950 Other fixed assets Total assets 132,000 133,000 ; . 61,000 57,000 In(e(\\est 43,000 $1,836,000) $1,667,000 30,680 [$ 159,950 Taxes (40%} Net income Accrued liabilities 320,000 $72.708 12,272 63,980 18408 |3 95,970 ) Notes payable 45,010 40,880 476,990 457,912 Total current liabilities Long-term debt Per-Share Data S$602,000 571,500 _ Common stock 404,290 258,898 575,000 575,000 Retained earnings 254,710 261,602 | Total liabilities and equity $1.836,000) $1,667,000 Cash dividends $l 10 S'D 95 Market price [avem e) $12.34 $23. 5'? PIE ratio Number of shares nutstand.mg 23,000 23,000 Ratios 2016 2015 DuPont Equation Liquidity Ratio ROE = Profit Margin Total Asset Turnover Equity Multiplier Current Ratio 2.33 2.11 2016 2.22% 0.43% 2.31 $2.21 Quick Ratio 0.85 0.69 2015 11.47% 2.64% 2.18 $1.99 Asset Management Ratio Inventory Turnover 4.74 4.47 Use the following information to calculate FCF for 2016 Days Sales Outstanding (365 days) 37.79 32.94 CAPEX -30,000 Fixed Assets Turnover 9.84 7.89 ANOWC $11,422 Total Assets Turnover 2.31 2.18 Debt Management Ratio FCF 2016 Time-Interest-Earned (TIE) 1.46 4.72 Profitability Ratio EBIT(1-T) $58608.00 Return on Assets 1.00% 5.76% Depreciation 159,000 Return on Equity 2.22% 11.47% CAPEX -30,000 Note that negative CAPEX may result from the proceed of Profit Margin 0.43% 2.64% ANOWC $11,422 Operating Margin 2.30% 5.58% Market Value Ratio FCF $236,186 P/E Ratio 15.42 5.65
Step by Step Solution
There are 3 Steps involved in it
1 Expert Approved Answer
Step: 1 Unlock
Question Has Been Solved by an Expert!
Get step-by-step solutions from verified subject matter experts
Step: 2 Unlock
Step: 3 Unlock
Students Have Also Explored These Related Finance Questions!