

Question: A WS student was interested in analyzing the time it takes cue bus to complete her commute from the Vienna Metro to WS. She collected
A WS student was interested in analyzing the time it takes cue bus to complete her commute from the Vienna Metro to WS. She collected data for 600 trips she took during her tenure at WS.
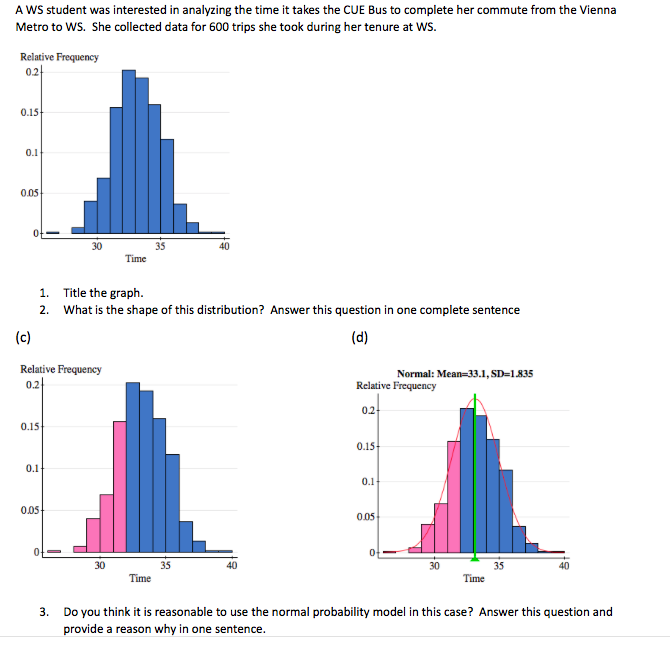
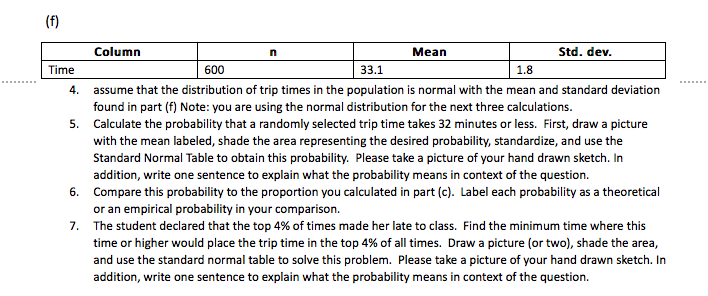
A WS student was interested in analyzing the time it takes the CUE Bus to complete her commute from the Vienna Metro to WS. She collected data for 600 trips she took during her tenure at WS. Relative Frequency 0.24 0.15 0.1 0.05. 30 35 Time 1. Title the graph. 2. What is the shape of this distribution? Answer this question in one complete sentence (c) (d) Relative Frequency 0.2 Normal: Mean=33.1, SD=1.835 Relative Frequency 0.2 0.15 0.15 0.1 0.1. 0.05 0.05 30 35 Time 35 Time Do you think it is reasonable to use the normal probability model in this case? Answer this question and provide a reason why in one sentence.(f) Column n Mean Std. dev. Time 600 33.1 1.8 4. assume that the distribution of trip times in the population is normal with the mean and standard deviation found in part (f) Note: you are using the normal distribution for the next three calculations. 5. Calculate the probability that a randomly selected trip time takes 32 minutes or less. First, draw a picture with the mean labeled, shade the area representing the desired probability, standardize, and use the Standard Normal Table to obtain this probability. Please take a picture of your hand drawn sketch. In addition, write one sentence to explain what the probability means in context of the question. 6. Compare this probability to the proportion you calculated in part (c). Label each probability as a theoretical or an empirical probability in your comparison. 7. The student declared that the top 4% of times made her late to class. Find the minimum time where this time or higher would place the trip time in the top 4% of all times. Draw a picture (or two), shade the area, and use the standard normal table to solve this problem. Please take a picture of your hand drawn sketch. In addition, write one sentence to explain what the probability means in context of the
Step by Step Solution
There are 3 Steps involved in it

Get step-by-step solutions from verified subject matter experts