

Question: AA 9 - 2 Comparative Analysis LO A 1 Key figures for Apple and Google follow. table [ [ , Apple,Google ] , [
AA Comparative Analysis LO A
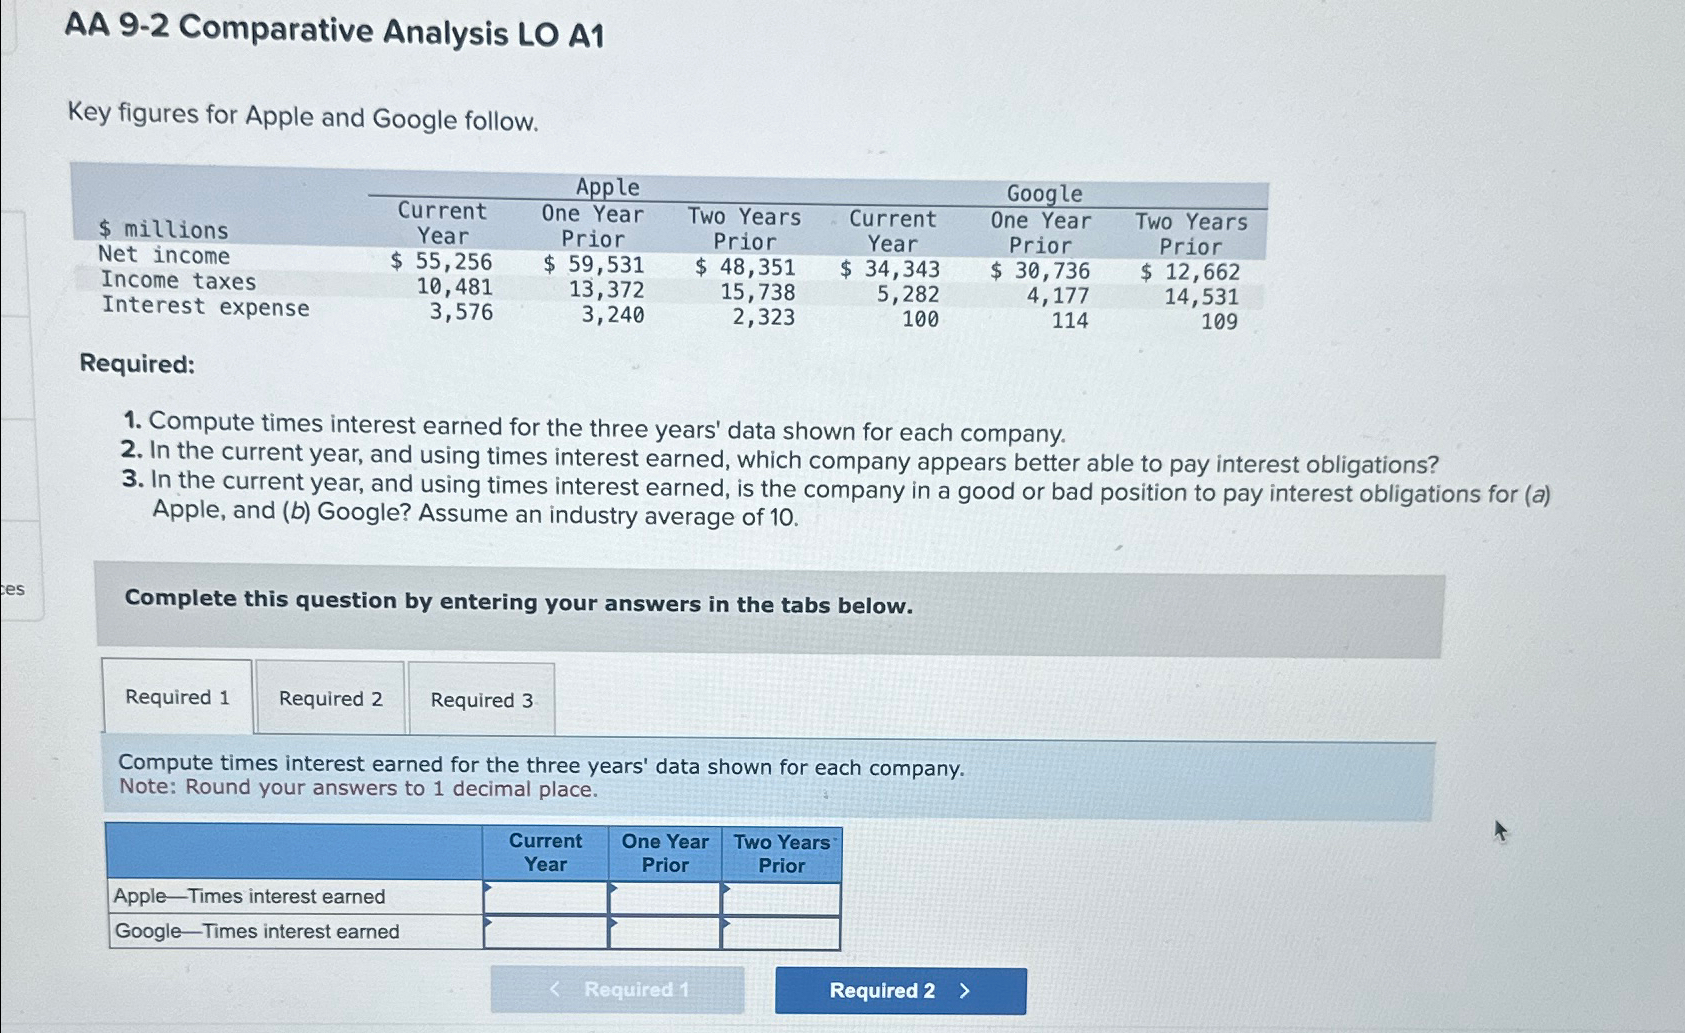
Key figures for Apple and Google follow.
tableApple,Google$ millions,Current,One Year,Two Years,Current,One Year,Two Years,Net income,Year,Prior,Prior,Year,Prior,Prior,Income taxes,$$$$$$Interest expense,
Required:
Compute times interest earned for the three years' data shown for each company.
In the current year, and using times interest earned, which company appears better able to pay interest obligations?
In the current year, and using times interest earned, is the company in a good or bad position to pay interest obligations for a Apple, and b Google? Assume an industry average of
Complete this question by entering your answers in the tabs below.
Required
Compute times interest earned for the three years' data shown for each company.
Note: Round your answers to decimal place.
tabletableCurrentYeartableOne YearPriortableTwo YearsPriorAppleTimes interest earned,,,GoogleTimes interest earned,,,
Step by Step Solution
There are 3 Steps involved in it
1 Expert Approved Answer
Step: 1 Unlock

Question Has Been Solved by an Expert!
Get step-by-step solutions from verified subject matter experts
Step: 2 Unlock
Step: 3 Unlock