

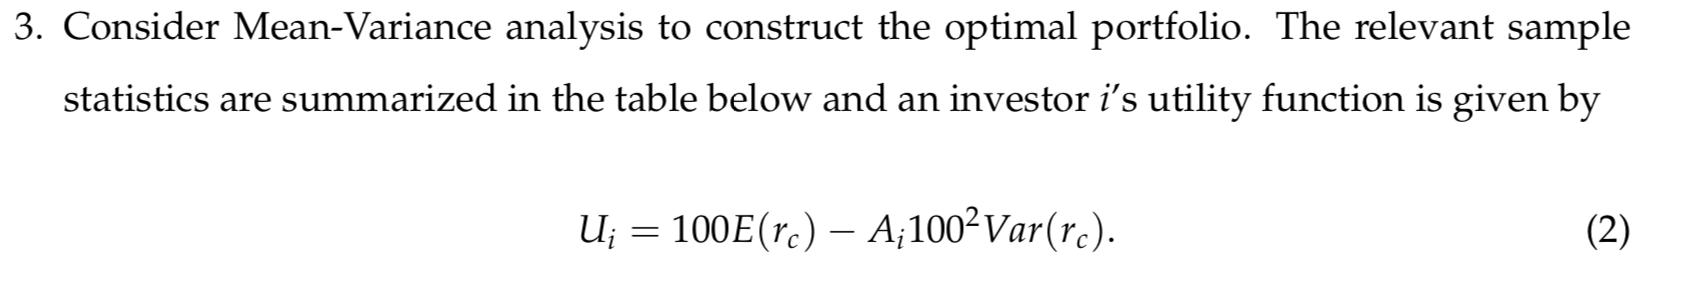
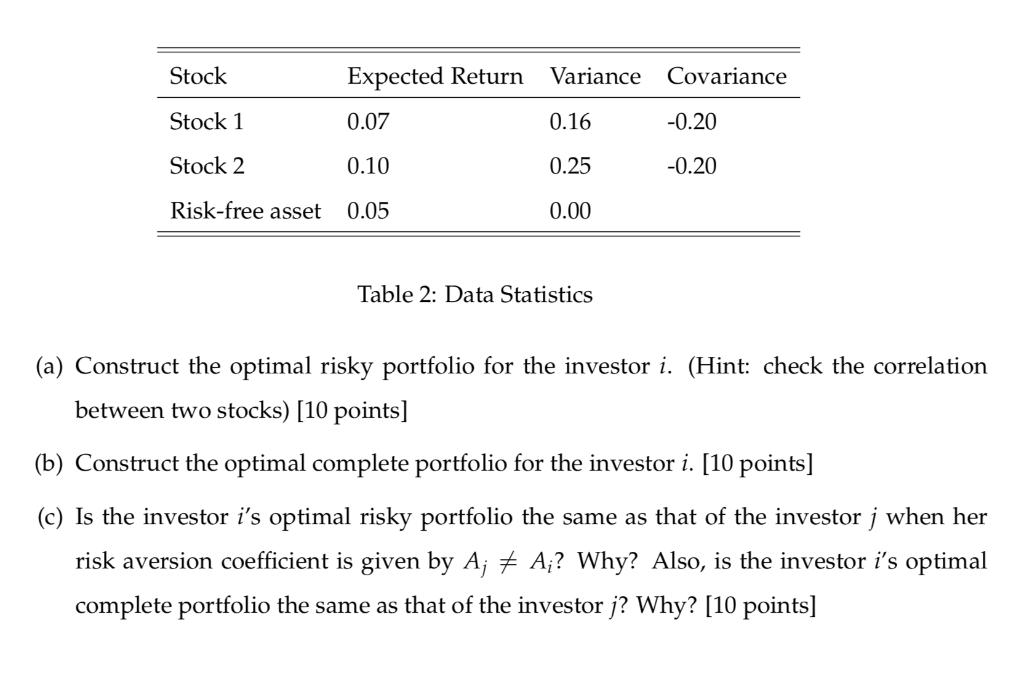
Question: . 3. Consider Mean-Variance analysis to construct the optimal portfolio. The relevant sample statistics are summarized in the table below and an investor i's utility
.
3. Consider Mean-Variance analysis to construct the optimal portfolio. The relevant sample statistics are summarized in the table below and an investor i's utility function is given by U; = 100E(r.) A;100Var(r.). (2)
Step by Step Solution
★★★★★
3.50 Rating (160 Votes )
There are 3 Steps involved in it
1 Expert Approved Answer
Step: 1 Unlock

Please see the answer as attachment 3 r 020 025 xr016 020 5804 02FI var ro 104w05W2 O 3 ay Wit propo... View full answer
Question Has Been Solved by an Expert!
Get step-by-step solutions from verified subject matter experts
Step: 2 Unlock
Step: 3 Unlock