

Question: The Table shown below provides the activities (A to L) and their three point estimates for an Auckland city IT infrastructure (LAN Network) project.
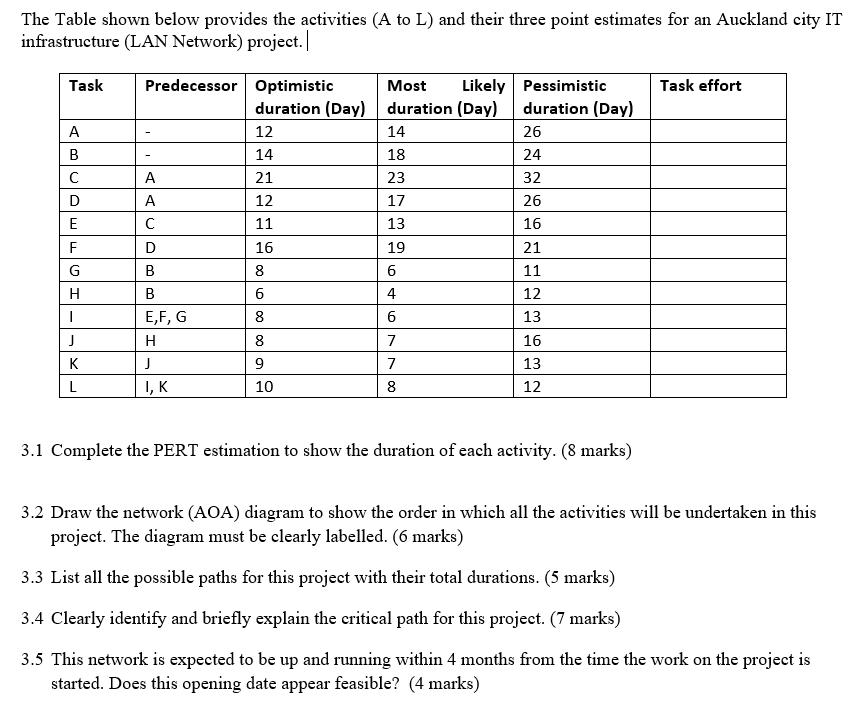
The Table shown below provides the activities (A to L) and their three point estimates for an Auckland city IT infrastructure (LAN Network) project. Task A B C D E F G H I J K L Predecessor Optimistic A A C D B B E, F, G H J I, K duration (Day) 12 14 21 12 11 16 0 8 6 8 8 9 10 Most Likely duration (Day) 14 18 23 17 13 19 6 4 6 7 7 8 Pessimistic duration (Day) 26 24 32 26 16 21 11 12 13 16 13 12 3.1 Complete the PERT estimation to show the duration of each activity. (8 marks) Task effort 3.2 Draw the network (AOA) diagram to show the order in which all the activities will be undertaken in this project. The diagram must be clearly labelled. (6 marks) 3.3 List all the possible paths for this project with their total durations. (5 marks) 3.4 Clearly identify and briefly explain the critical path for this project. (7 marks) 3.5 This network is expected to be up and running within 4 months from the time the work on the project is started. Does this opening date appear feasible? (4 marks)
Step by Step Solution
3.40 Rating (163 Votes )
There are 3 Steps involved in it
PERT estimation To calculate the PERT estimation for each activity we will use the formula Expected ... View full answer

Get step-by-step solutions from verified subject matter experts